Top 100 Fastest Growing Cities in America: The Exurban Realignment


The landscape of American urbanization is undergoing a monumental transformation. According to the newly released U.S. Census Bureau population estimates, the historic trend of megacity expansion has plateaued, giving rise to an unprecedented exurban boom. Emerging edge cities, outerring suburbs, and midsized sunbelt municipalities are now leading the nation to demographic growth.
While core cities such as New York, Los Angeles, and Chicago maintain their status as the nation's most populous centers, smaller communities locatedroughly fortyfive to sixty minutes outside of major metropolitan business districts are absorbing most of the inbound domestic migration. This geographic shift is driven by a complex interplay of remote and hybrid work stability, corporate decentralization, housing affordability challenges, and a growing consumer preference for localized community safety and infrastructure.
The MacroDrivers of the Modern Exurban Realignment
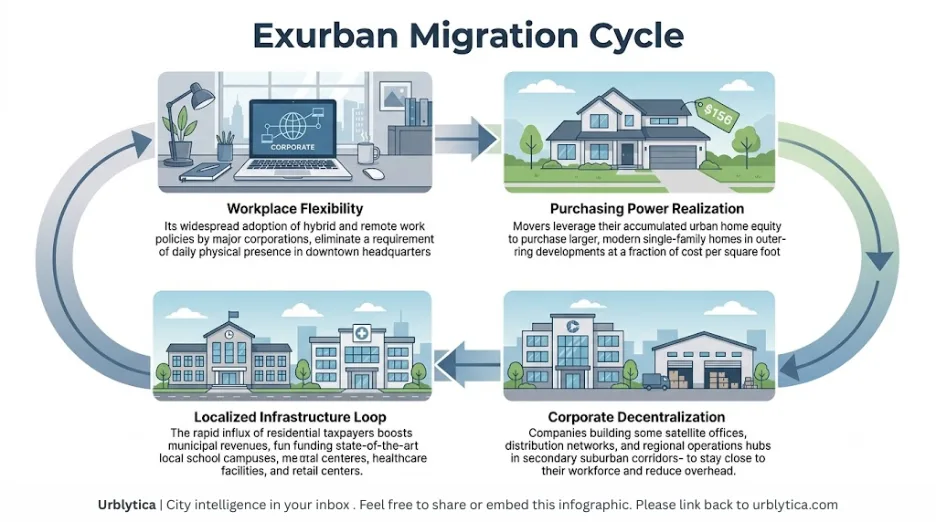
To understand why cities with populations between 20,000 and 100,000 are experiencing doubledigit percentage population growth, we must examine the structural shifts in the American economy. The permanence of hybrid work has freed millions of whitecollar professionals from the necessity of daily physical commutes to downtown business cores. Consequently, families are trading compact urban apartments for spacious suburban housing.
Furthermore, major corporate entities have decentralized their operations, establishing regional offices in secondary and tertiary markets. This movement has catalyzed localized job creation, transforming erstwhile bedroom communities into selfsustaining economic hubs. This trend has also altered consumer spending patterns, as suburban retail, healthcare services, and local schools experience unprecedented demand pressure.
Economic development departments and state authorities are responding by rapidly constructing highway corridors, municipal utility systems, and mixeduse commercial properties to accommodate the influx. For entrepreneurs planning to establish storefronts or local service enterprises within these rapidgrowth zones, utilizing a comprehensive startup filing guide can help streamline statelevel entity registration.
Regional Hotspots: The Dominance of the South and West
The geographic distribution of America's fastestgrowing cities is heavily concentrated in the Sun Belt, with the South claiming a staggering majority of the topperforming municipalities. Texas leads the nation, driven by a businessfriendly tax environment, robust job market, and relative abundance of buildable land. The Texas Triangle, which connects the metropolitan areas of DallasFort Worth, Houston, Austin, and San Antonio, contains dozens of the country’s absolute fastestgrowing suburbs.
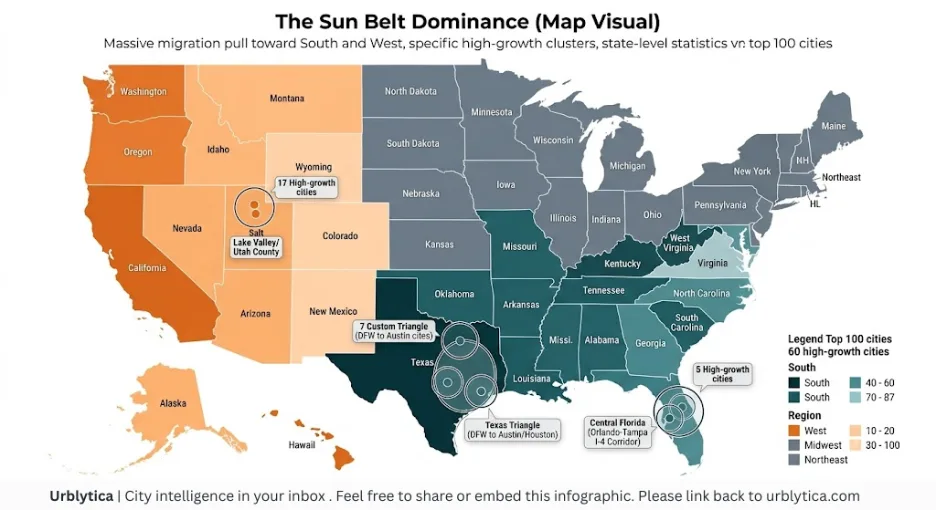
Beyond Texas, Florida and the Carolinas continue to draw massive inbound migration. Florida’s growth is fueled by retirees, remote workers, and servicesector expansion, while North and South Carolina are leveraging their manufacturing, technology, and university pipelines to attract highly skilled talent.
In the West, the Intermountain region is experiencing a parallel boom. States like Utah, Idaho, and Arizona are capturing outflows from highcost coastal states, primarily California and Washington. Communities in Utah’s Utah County and Idaho’s Treasure Valley have recorded rapid yearoveryear population spikes, creating localized strains on housing inventories and public infrastructure.
DeepDive Analysis of the Nation’s FastestGrowing Cities
1. Celina, Texas
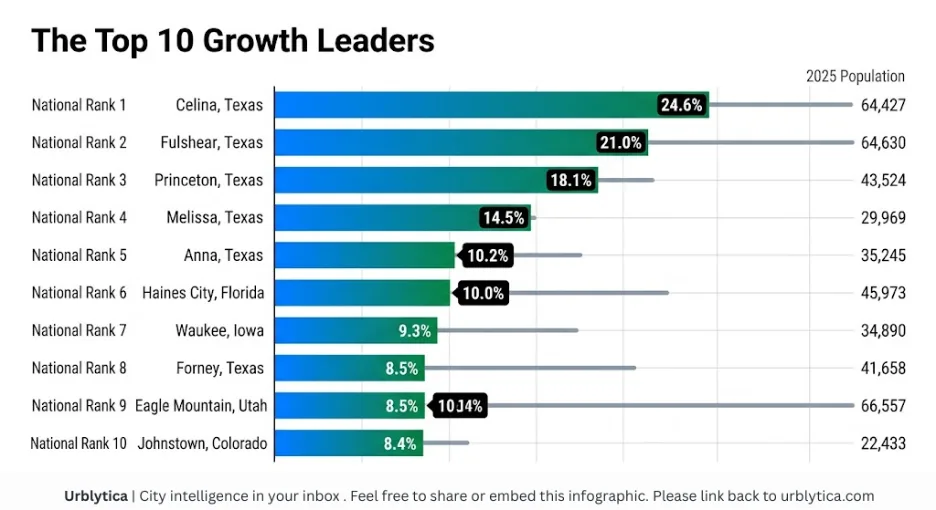
Located approximately forty miles north of downtown Dallas, Celina stands as the fastestgrowing city in America. With a staggering yearoveryear growth rate of 24.6 percent, the city’s population has surged to 64,427 residents. This growth represents a nearquadrupling of Celina's population since 2020. The expansion is supported by masterplanned communities, highperforming public schools, and its proximity to major corporate headquarters in nearby Frisco and Plano.
2. Fulshear, Texas
Located in the western reaches of the Houston metropolitan area, Fulshear ranks second nationally with a 21.0 percent annual population increase. Fulshear has transformed from a quiet agricultural community into an upscale suburban haven of 64,630 residents. High median household incomes, exceptional local school systems, and sprawling acreage communities continue to draw affluent families looking for an escape from Houston’s innercity congestion.
3. Princeton, Texas
Another powerhouse suburb in the DallasFort Worth metroplex, Princeton has experienced an 18.1 percent growth rate, bringing its total population to 43,524. Princeton sits along the eastern edge of Collin County, offering a more affordable alternative to adjacent markets. The rapid expansion of singlefamily housing developments along the Highway 380 corridor has turned Princeton into a premier destination for firsttime homebuyers.
4. Melissa, Texas
Melissa, located northeast of McKinney in Collin County, ranks fourth with an annual growth rate of 14.5 percent, pushing its population to 29,969. Known for its strong community identity and investments in youth athletic complexes and educational facilities, Melissa has successfully capitalized on the northward expansion of the Dallas metropolitan area.
5. Anna, Texas
Directly adjacent to Melissa along the Interstate 75 corridor, Anna grew 10.2 percent to a population of 35,245. Anna represents the outer frontier of northern Dallas suburbanization, offering competitive land prices for residential developers and attracting commercial retail brands seeking untapped consumer markets.
6. Haines City, Florida
Haines City, located within the LakelandWinter Haven metropolitan area in central Florida, grew by 10.0 percent, reaching 45,973 residents. Positioned strategically between Tampa and Orlando, Haines City has become a major logistics hub and an attractive, affordable alternative for tourism industry workers and retirees.
7. Waukee, Iowa
Waukee represents the lone Midwestern entry in the upper echelons of the list, growing by 9.3 percent to a population of 34,890. As a prominent western suburb of Des Moines, Waukee has benefited from massive technological investments, including largescale hyperscale data centers, alongside exceptional public school ratings.
8. Forney, Texas
Located east of Dallas in Kaufman County, Forney grew by 8.5 percent to a population of 41,658. Dubbed by the antique capital of Texas, Forney is quickly transitioning into a major residential suburb, buoyed by highly competitive home prices and rapid commercial development along Interstate 20.
9. Eagle Mountain, Utah
Eagle Mountain, situated in the southern hills of the Salt Lake CityProvoOrem corridor, recorded an 8.5 percent growth rate, bringing its population to 66,557. The city’s expansive geography has allowed it to accommodate major technology manufacturing facilities, while offering younger families a realistic path to homeownership.
10. Johnstown, Colorado
Johnstown, a scenic northern Colorado town situated between Loveland and Greeley, experienced an 8.4 percent population increase to reach 22,433 residents. Its strategic location along the Interstate 25 corridor makes it an ideal commuter town for professionals working in both Fort Collins and the northern Denver suburbs.
Master Ranking: Top 100 Fastest Growing Cities in America
The following structured database presents the top 100 fastestgrowing cities in the United States with populations of 20,000 or more, sorted by annual percentage growth according to the latest federal estimates.
|
Rank |
City |
State |
Metro Area |
2025 Population |
Growth Rate |
|
1 |
Celina |
Texas |
Dallas-Fort Worth |
64,427 |
24.6% |
|
2 |
Fulshear |
Texas |
Houston Metro |
64,630 |
21.0% |
|
3 |
Princeton |
Texas |
Dallas-Fort Worth |
43,524 |
18.1% |
|
4 |
Melissa |
Texas |
Dallas-Fort Worth |
29,969 |
14.5% |
|
5 |
Anna |
Texas |
Dallas-Fort Worth |
35,245 |
10.2% |
|
6 |
Haines City |
Florida |
Lakeland-Winter Haven |
45,973 |
10.0% |
|
7 |
Waukee |
Iowa |
Des Moines Metro |
34,890 |
9.3% |
|
8 |
Forney |
Texas |
Dallas-Fort Worth |
41,658 |
8.5% |
|
9 |
Eagle Mountain |
Utah |
Provo-Orem-Lehi |
66,557 |
8.5% |
|
10 |
Johnstown |
Colorado |
Fort Collins-Loveland |
22,433 |
8.4% |
|
11 |
Kuna |
Idaho |
Boise City Metro |
31,525 |
8.4% |
|
12 |
Queen Creek |
Arizona |
Phoenix-Mesa-Chandler |
89,770 |
8.2% |
|
13 |
Hutto |
Texas |
Austin-Round Rock |
46,048 |
7.9% |
|
14 |
Foley |
Alabama |
Daphne-Fairhope-Foley |
30,354 |
7.8% |
|
15 |
Greenville |
Texas |
Dallas-Fort Worth |
37,069 |
7.5% |
|
16 |
Saratoga Springs |
Utah |
Provo-Orem-Lehi |
66,106 |
7.4% |
|
17 |
Fort Mill |
South Carolina |
Charlotte Metro |
41,426 |
6.8% |
|
18 |
Port Chester |
New York |
New York Metro |
31,200 |
4.1% |
|
19 |
Iowa Colony |
Texas |
Houston Metro |
22,650 |
17.6% |
|
20 |
Royse City |
Texas |
Dallas-Fort Worth |
31,461 |
14.8% |
|
21 |
Manvel |
Texas |
Houston Metro |
22,934 |
14.6% |
|
22 |
Star |
Idaho |
Boise City Metro |
22,547 |
11.9% |
|
23 |
Manor |
Texas |
Austin Metro |
24,952 |
10.0% |
|
24 |
Fate |
Texas |
Dallas-Fort Worth |
31,251 |
9.2% |
|
25 |
Georgetown |
Texas |
Austin Metro |
115,088 |
9.0% |
|
26 |
Moncks Corner |
South Carolina |
Charleston Metro |
21,875 |
8.5% |
|
27 |
Kyle |
Texas |
Austin Metro |
74,790 |
8.3% |
|
28 |
Leander |
Texas |
Austin Metro |
97,835 |
8.2% |
|
29 |
West Haven |
Utah |
Ogden-Clearfield |
27,512 |
8.2% |
|
30 |
Coolidge |
Arizona |
Phoenix Metro |
21,392 |
8.1% |
|
31 |
Centerton |
Arkansas |
Fayetteville Metro |
29,041 |
8.1% |
|
32 |
Prosper |
Texas |
Dallas-Fort Worth |
49,025 |
8.0% |
|
33 |
Minneola |
Florida |
Orlando Metro |
22,420 |
7.9% |
|
34 |
Lathrop |
California |
Stockton Metro |
45,719 |
7.8% |
|
35 |
Leesburg |
Florida |
Orlando Metro |
41,549 |
7.4% |
|
36 |
Leland |
North Carolina |
Myrtle Beach Metro |
38,032 |
7.1% |
|
37 |
Red Oak |
Texas |
Dallas-Fort Worth |
21,632 |
7.0% |
|
38 |
Westfield |
Indiana |
Indianapolis Metro |
70,232 |
6.9% |
|
39 |
Fuquay-Varina |
North Carolina |
Raleigh Metro |
51,449 |
6.9% |
|
40 |
Kiryas Joel |
New York |
New York Metro |
49,823 |
6.8% |
|
41 |
Seguin |
Texas |
San Antonio Metro |
43,404 |
6.7% |
|
42 |
Greer |
South Carolina |
Greenville Metro |
52,676 |
6.6% |
|
43 |
Lebanon |
Tennessee |
Nashville Metro |
56,325 |
6.4% |
|
44 |
Santaquin |
Utah |
Provo Metro |
20,091 |
6.4% |
|
45 |
Auburndale |
Florida |
Lakeland Metro |
22,590 |
6.2% |
|
46 |
Groveland |
Florida |
Orlando Metro |
26,952 |
6.1% |
|
47 |
Little Elm |
Texas |
Dallas-Fort Worth |
66,237 |
6.0% |
|
48 |
Terrell |
Texas |
Dallas-Fort Worth |
25,217 |
6.0% |
|
49 |
Erie |
Colorado |
Denver Metro |
42,967 |
5.9% |
|
50 |
Buckeye |
Arizona |
Phoenix Metro |
131,812 |
5.9% |
|
51 |
Maricopa |
Arizona |
Phoenix Metro |
82,372 |
5.8% |
|
52 |
Athens |
Alabama |
Huntsville Metro |
35,936 |
5.7% |
|
53 |
Boerne |
Texas |
San Antonio Metro |
25,209 |
5.7% |
|
54 |
Commerce City |
Colorado |
Denver Metro |
73,150 |
5.5% |
|
55 |
Mt. Juliet |
Tennessee |
Nashville Metro |
42,850 |
5.4% |
|
56 |
Noblesville |
Indiana |
Indianapolis Metro |
74,510 |
5.3% |
|
57 |
Apex |
North Carolina |
Raleigh Metro |
75,220 |
5.2% |
|
58 |
Bluffton |
South Carolina |
Savannah Metro |
37,410 |
5.1% |
|
59 |
Nampa |
Idaho |
Boise City Metro |
114,820 |
5.0% |
|
60 |
Meridian |
Idaho |
Boise City Metro |
135,410 |
4.9% |
|
61 |
Herriman |
Utah |
Salt Lake City Metro |
65,320 |
4.8% |
|
62 |
Bentonville |
Arkansas |
Fayetteville Metro |
61,450 |
4.7% |
|
63 |
Rogers |
Arkansas |
Fayetteville Metro |
79,230 |
4.6% |
|
64 |
Surprise |
Arizona |
Phoenix Metro |
158,210 |
4.5% |
|
65 |
Goodyear |
Arizona |
Phoenix Metro |
108,450 |
4.4% |
|
66 |
St. Cloud |
Florida |
Orlando Metro |
68,910 |
4.3% |
|
67 |
Horizon City |
Texas |
El Paso Metro |
28,450 |
4.2% |
|
68 |
Wildwood |
Florida |
The Villages Metro |
21,340 |
4.2% |
|
69 |
Winter Garden |
Florida |
Orlando Metro |
51,280 |
4.1% |
|
70 |
Conroe |
Texas |
Houston Metro |
108,410 |
4.0% |
|
71 |
New Braunfels |
Texas |
San Antonio Metro |
128,712 |
4.0% |
|
72 |
Lake Elsinore |
California |
Riverside Metro |
74,320 |
3.9% |
|
73 |
Menifee |
California |
Riverside Metro |
112,850 |
3.9% |
|
74 |
Murrieta |
California |
Riverside Metro |
117,210 |
3.8% |
|
75 |
Rock Hill |
South Carolina |
Charlotte Metro |
78,410 |
3.7% |
|
76 |
Summerville |
South Carolina |
Charleston Metro |
54,320 |
3.6% |
|
77 |
Mount Pleasant |
South Carolina |
Charleston Metro |
97,450 |
3.5% |
|
78 |
Fishers |
Indiana |
Indianapolis Metro |
105,420 |
3.4% |
|
79 |
Greenwood |
Indiana |
Indianapolis Metro |
68,230 |
3.4% |
|
80 |
Ocala |
Florida |
Ocala Metro |
69,450 |
3.3% |
|
81 |
Smyrna |
Tennessee |
Nashville Metro |
57,890 |
3.2% |
|
82 |
Spring Hill |
Tennessee |
Nashville Metro |
56,410 |
3.1% |
|
83 |
Gallatin |
Tennessee |
Nashville Metro |
49,870 |
3.1% |
|
84 |
Concord |
North Carolina |
Charlotte Metro |
110,450 |
3.0% |
|
85 |
Gastonia |
North Carolina |
Charlotte Metro |
83,410 |
3.0% |
|
86 |
Kannapolis |
North Carolina |
Charlotte Metro |
56,120 |
2.9% |
|
87 |
Huntersville |
North Carolina |
Charlotte Metro |
64,850 |
2.9% |
|
88 |
Round Rock |
Texas |
Austin Metro |
134,890 |
2.8% |
|
89 |
Cedar Park |
Texas |
Austin Metro |
81,420 |
2.8% |
|
90 |
Pflugerville |
Texas |
Austin Metro |
72,450 |
2.7% |
|
91 |
McKinney |
Texas |
Dallas-Fort Worth |
215,410 |
2.7% |
|
92 |
Frisco |
Texas |
Dallas-Fort Worth |
225,890 |
2.6% |
|
93 |
Allen |
Texas |
Dallas-Fort Worth |
111,210 |
2.6% |
|
94 |
Pearland |
Texas |
Houston Metro |
129,450 |
2.5% |
|
95 |
Sugar Land |
Texas |
Houston Metro |
114,820 |
2.5% |
|
96 |
League City |
Texas |
Houston Metro |
118,230 |
2.4% |
|
97 |
Clovis |
California |
Fresno Metro |
125,410 |
2.4% |
|
98 |
Roseville |
California |
Sacramento Metro |
158,910 |
2.3% |
|
99 |
Bend |
Oregon |
Bend Metro |
107,320 |
2.3% |
|
100 |
Bozeman |
Montana |
Bozeman Metro |
58,450 |
2.2% |
Infrastructure and Public Sector Capacity Challenges
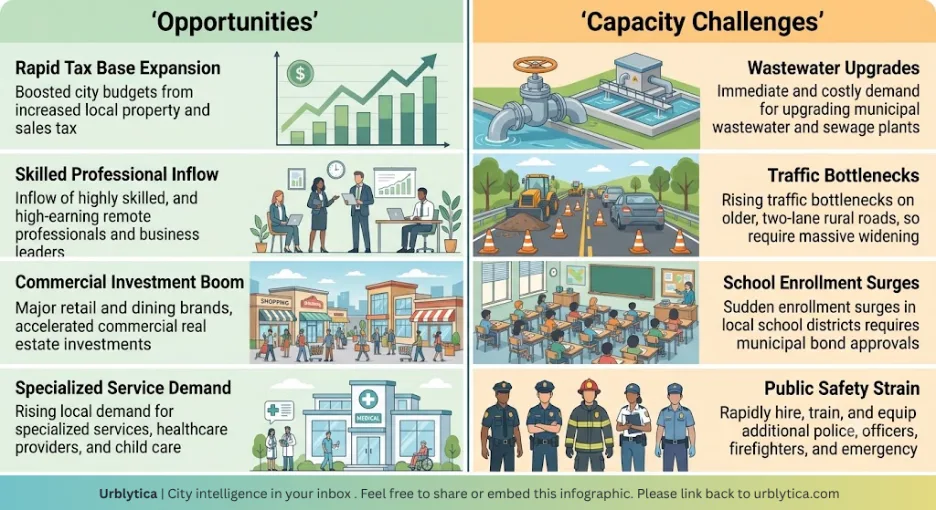
While population expansion brings immediate economic vitality, it simultaneously imposes significant fiscal and logistical pressure on local municipal administrations. Booming cities are forced to rapidly expand wastewater treatment capacities, widen secondary roadways, and secure longterm water rights. School districts within highgrowth counties face overcrowded classrooms, frequently requiring the passage of municipal bond packages to fund the construction of new educational campuses.
Furthermore, public safety departments must scale their operations to maintain service standards. Police, fire, and emergency medical services require additional regional stations and staff. For municipal planners, managing this rapid transition from rural or semisuburban environments to highdensity municipal corridors requires deep coordination. Local governments are increasingly relying on realtime data analytics and geographic information systems to map development proposals against existing infrastructure capacities.
The MicroImpact: Healthcare Services and Senior Living Demand
Demographic migration does not occur in a vacuum; it changes the social fabric of the receiving regions. While most outbound exurban movers consist of workingage professionals and young families, there is a secondary migration wave involving older demographics. Aging baby boomers are relocating to these highgrowth zones to remain in close proximity to their children and grandchildren.
This demographic alignment is causing a major surge in local demand for localized physical therapy centers, preventative medicine offices, and senior support organizations. Families navigating these transitions often face complex healthcare coordination challenges. In these situations, accessing a professional care services platform is essential to identify local domestic care networks and coordinate routine household assistance.
Additionally, as the average age within these highgrowth corridors creeps upward, the need for formal eldercare facilities increases. Families searching for longterm options can utilize a dedicated senior living directory to comparing local senior housing alternatives, retirement communities, and dedicated nursing options.
Financial Considerations: Budgeting and Asset Management during Relocation
For individual households, moving across state lines or even transitioning from a dense urban core to an outerring suburb requires meticulous financial auditing. Differences in property tax structures, local municipal utility rates, and home insurance premiums can radically alter a family's monthly budget.
Prospective homebuyers must calculate their purchasing power, factoring in fluctuating mortgage rates and localized property valuations. To streamline this process, buyers can leverage interactive online calculators to evaluate how varying payments and interest rates will affect their longterm debt servicing.
Furthermore, transitioning households are advised to audit their existing digital commitments. Using a specialized recurring expense analyzer helps families identify and cancel unnecessary subscription packages or redundant digital services before relocating. This process ensures that household cash flow remains optimized to cover the transaction costs associated with purchasing or renting in a highdemand housing market.
Security and Logistics in the Relocation Workflow
The administrative burden of relocating is substantial. Managing lease applications, credit check submissions, and property disclosures involves transmitting highly sensitive personal identifiable information across municipal and state borders. In an era of heightened digital vulnerability, protecting personal data is of paramount importance.
When uploading income statements, banking details, or identity documents to digital real estate portals, individuals should process their files through a trusted data sanitization tool to strip hidden metadata and sensitive information.
Moreover, organizing the logistics of a household transitionfrom contracting professional moving companies to updating utility hookups and registering vehiclesrequires disciplined schedule tracking. Adopting a digital deep work planner helps professionals and families manage these complex checklists systematically, minimizing operational disruptions during the move.
Local Business Ecosystem Growth and Corporate Entity Formations
As residential populations grow, they create immediate commercial opportunities for local service companies, restaurants, construction contractors, and professional firms. Highdensity residential zones require localized retail support, transforming vacant commercial parcels into vibrant shopping and lifestyle destinations.
For service providers aiming to capture the market share represented by new residents, visibility is critical. Registering their company details on a prominent online business listings site allows local enterprises to optimize their local SEO footprint, making it easier for new arrivals to discover their offerings.
Furthermore, companies operating in these highgrowth areas must remain diligent regarding regulatory compliance. As city boundaries expand and municipal tax codes adapt, businesses must maintain close alignment with statelevel updates. Working with a dedicated business compliance platform helps small business owners and corporate entities manage their annual reports, corporate filings, and licensing renewals seamlessly, avoiding administrative penalties and ensuring uninterrupted operations.
LongTerm Outlook: Sustainable Growth vs. Urban Sprawl
The ongoing exurban realignment presents both opportunities and risks for the future of American urbanization. If managed sustainably through smart zoning laws, public transit investments, and mixeduse commercial design, these fastgrowing communities can evolve into resilient, selfsustaining economic hubs. However, unmanaged growth risks creating extensive suburban sprawl, rising environmental degradation, and longterm traffic congestion.
As the decade progresses, the cities that successfully balance physical infrastructure expansion with environmental preservation and economic diversity will remain at the top of America's growth rankings. Those that fail to plan adequately may face severe growing pains, highlighting the critical role that comprehensive urban analytics and planning play in the modern demographic era.
Frequently Asked Questions (FAQs)
1. What defines an exurban city in America?
An exurban city, or exurb, is a fast-growing, medium-density community situated outside the established ring of traditional suburbs surrounding a major metropolitan area. Typically located forty-five to sixty minutes away from primary downtown employment centers; these cities offer lower land costs, newer housing stock, and rapidly developing local commercial economies.
2. Why are Texas and Florida leading the nation to population growth?
Texas and Florida lead because of their highly favorable economic environments, which include no state income tax, low regulatory barriers for business setup, and a lower overall cost of living relative to coastal states. Additionally, both states possess vast corridors of buildable flat land adjacent to major metropolitan areas, allowing developers to meet the massive demand for new housing.
3. How does hybrid and remote work affect exurban demographic shifts?
Hybrid and remote work models have fundamentally decoupled employment from physical location, allowing professionals to live further away from corporate offices. Because daily commuting is no longer mandatory for many office workers, families are choosing to relocate to exurban areas to prioritize larger homes, better school districts, and lower population density.
4. What are the main infrastructure challenges faced by rapidly growing cities?
The primary challenges include immediate capacity strains on municipal wastewater treatment plants, severe traffic congestion on secondary roads designed for rural use, classroom overcrowding in local school districts, and the urgent need to expand municipal public safety departments, including police, fire, and emergency medical services.
5. How do families manage financial calculations when relocating to high-growth suburbs?
Relocating families must carefully evaluate differences in municipal property tax rates, home insurance premiums, and utility costs. Many utilize interactive home financial calculators to analyze monthly mortgage payments alongside dedicated subscription cost trackers to audit and manage monthly recurring subscription costs.
6. Why are older generations migrating to fast-growing exurban communities?
A significant secondary wave of migration consists of baby boomers and retirees who relocate to these outer suburbs to remain close to their children and grandchildren. This demographic shift has created high demand for local medical infrastructure, senior housing directories, and regional home care service platforms.
7. What precautions should be taken to protect personal data during a relocation process?
Moving involves sharing highly sensitive personal documents, including lease agreements, employment verifications, and credit histories, with multiple digital portals. To prevent identity theft, individuals should process all financial statements and identification files through a data sanitization program to redact hidden metadata and sensitive personal identifiers before transmission.
8. How do new residents discover local services and businesses in their new cities?
New arrivals rely heavily on digital maps and local business directories to find medical services, dining, retail, and home contractors. Local companies optimize their visibility by maintaining active profiles on online business listings to capture this fresh, high-intent consumer traffic.
9. What is the difference between sustainable exurban growth and urban sprawl?
Sustainable growth involves proactive municipal planning, such as implementing smart zoning laws, building public transit corridors, and designing mixed-use walkable town centers. In contrast, urban sprawl occurs when development is uncoordinated, leading to car dependency, environmental damage, and high long-term infrastructure maintenance costs.
10. Where does the demographic data for the top 100 fastest-growing cities come from?
The demographic data is compiled directly from the annual population and housing unit estimates released by the United States Census Bureau. The rankings analyze year-over-year percentage growth rates for incorporated municipalities with a baseline population of 20,000 or more.