



City Profile
St. Louis, Missouri
USA · Comprehensive city data and intelligence
St. Louis, Missouri, a city rich in history and culture, is situated along the western bank of the Mississippi River. Known as the 'Gateway to the West,' it is famously home to the iconic Gateway Arch, symbolizing its historical role in westward expansion. The city boasts a vibrant arts scene, diverse culinary offerings, and numerous free attractions, making it an appealing destination for residents and visitors alike. Despite a declining city population, the broader St. Louis metropolitan area has experienced growth, driven partly by international immigration. People are drawn to St. Louis for its unique blend of urban amenities, historic charm, and relatively affordable cost of living compared to many other major U.S. cities.
Missouri, known as the "Show-Me State," offers a diverse landscape from the Ozark Mountains to the Missouri River, characterized by a continental climate with hot, humid summers and cold winters, experiencing all four seasons. Its economy is highly diversified, with major industries including agriculture, manufacturing (especially transportation equipment and food processing), financial services, and a growing presence in high-tech fields like agtech and cybersecurity. Living in Missouri is generally affordable, consistently ranking among the states with the lowest cost of living, with housing costs significantly below the national average. The lifestyle offers a blend of urban amenities in cities like St. Louis and Kansas City, known for their arts, music, and professional sports, alongside abundant outdoor recreation opportunities.
How this 48/100 was calculated five components, with every reading behind them
| Component | Readings used | Points | Weight | Contributes |
|---|---|---|---|---|
| Safety | Safety score: 30 / 100 | 30.0 | 30% | 9.0 |
| Affordability | Cost of living index (100 = national baseline): 89.0 | 57.5 | 25% | 14.4 |
| Economy & jobs | Median household income: $56,160 Income needed to live here: $55,000 Unemployment rate: 4% | 51.3 | 20% | 10.3 |
| Growth | Population growth rate: no usable reading Job growth rate: 1.5% | 50.0 | 15% | 7.5 |
| Business climate assessment | Business climate assessment: 68 / 100 | 68.0 | 10% | 6.8 |
| Overall score | 47.9 | |||
Provenance.
These figures were produced by the research pass recorded as
Gemini (Tier 2 (reasoned), q=84), last refreshed
4 August 2026.
They are researched estimates drawn from public sources, not a licensed data feed.
Each component is scored against fixed published endpoints, so this number is comparable with any other city and does not move as the dataset grows. Scoring framework 2026.10 — full methodology, weights and accepted ranges.

Featured Events
Happening in St. Louis
Featured and sponsored events in St. Louis.
Local Directory
Businesses in St. Louis
Featured local businesses in St. Louis.

Performance
Quality Scores
Expenses
Cost of Living
The cost of living in St. Louis is notably more affordable than the national average, standing at approximately 11% lower overall. Housing is a significant driver of this affordability, with average rents and median home prices considerably below the U.S. average. For instance, rentals in St. Louis are about 30% lower than the national average. While housing costs are lower, utility expenses are comparable to or slightly below national averages, with energy bills around $193.81 per month. Groceries are also generally budget-friendly, being about 0.8% lower than the national average.
Income
Salary Insights
The St. Louis metropolitan area's economy is diverse, with key employment sectors including education and health services, trade and transportation, and professional and business services. The city is also seeing growth in its logistics and tech industries, contributing to a resilient commercial real estate sector. Major institutions like Washington University in St. Louis and Barnes-Jewish Hospital are significant economic engines. While specific job growth rates for the city are not readily available, the broader metro area has shown population growth, suggesting underlying economic activity. The unemployment rate in St. Louis was 4% as of May 2026, which is comparable to the national average.
The average salary in St. Louis is $45,000 per year. You would need approximately $55,000 to live comfortably.
Employment
Top Industries
Weather
Climate
Mobility
Transport
Getting around St. Louis primarily relies on personal vehicles, with a high car dependency where nearly 90% of commuters use a car for work or school. The average commute time is around 28 minutes. Public transportation, including the MetroLink light rail and MetroBus system, offers an affordable and simple way to navigate the city, connecting key areas like Lambert Airport to downtown. The city is also investing in improving its bike infrastructure, with new protected bike lanes and greenways planned to enhance cycling safety and connectivity. Despite these efforts, walkability and transit scores remain moderate, reflecting the city's car-centric layout outside of its compact downtown core.

At a Glance
Pros & Cons
Advantages
Drawbacks
Head to Head
Compare St. Louis
Community Q&A
Questions about St. Louis
What people ask about living in and moving to St. Louis, Missouri.
How are the public schools in St. Louis rated?
Public schools in St. Louis vary widely in performance. Some districts have strong academic programs and extracurriculars, while others face challenges. Parents often look at state assessment scores, graduation rates, and parent reviews. Visiting school sites, attending open houses, and consulting the state education department’s school rating tools can help you assess which schools align with your expectations.
What kinds of healthcare facilities are available in St. Louis?
St. Louis hosts a mix of hospitals, specialty clinics, and urgent‑care centers that serve a large metropolitan population. Facilities range from large academic medical centers to community hospitals. Many offer outpatient services, diagnostic imaging, and specialty consults. To find the best fit, review local health system directories, read patient reviews, and confirm that your insurance network includes the chosen...
How does the cost of living in St. Louis compare to other U.S. cities?
St. Louis has a cost of living index of 89, meaning expenses are roughly 11% lower than the national average. Housing is a major factor: the average rent is $1,439 per month, which is modest compared to many larger metros. Everyday items like groceries, utilities, and transportation also tend to be cheaper. If you’re used to higher prices, you’ll likely find your budget stretches further in St. Louis, especially if y...
What public transportation options are available in St. Louis?
St. Louis offers a network of bus routes and commuter rail lines that connect downtown, suburbs, and regional destinations. The city’s transit authority runs frequent services, and riders can purchase monthly passes or use mobile payment apps. Biking infrastructure is expanding, with dedicated lanes and bike‑share programs. Checking the transit authority’s website for schedules, fare maps, and real‑time updates will...
What are some popular cultural attractions in St. Louis?
St. Louis offers a variety of cultural venues, including museums, theaters, and music halls that showcase regional and national talent. Outdoor spaces such as parks, riverfront trails, and botanical gardens provide recreation and scenic views. The city’s arts districts host galleries, street art, and seasonal festivals. Checking city tourism portals and event calendars will give you up‑to‑date information on exhibiti...
What is the average rent for a one-bedroom apartment in St. Louis?
The average rent for a one-bedroom apartment in St. Louis is $1,439 per month. This figure represents a typical price across the city, though rates can vary by neighborhood. Areas closer to transit routes or downtown usually command higher rents, while suburbs and older districts may offer lower rates. Checking local listings and contacting real‑estate agents can give you a clearer idea of current market conditions i...
Is St. Louis considered a safe city for families?
St. Louis has a safety score of 30.0 out of 100, indicating a higher crime rate relative to many other U.S. cities. Crime can be concentrated in certain neighborhoods, while others maintain lower rates. It’s important to research neighborhood crime statistics, talk to local residents, and review police reports. Visiting areas at different times and speaking with community leaders can provide a clearer picture of safe...
What is the average salary for a software engineer in St. Louis?
The average salary in St. Louis is $45,000 per year. While this is a citywide average across all industries, tech roles often pay above the median. However, salaries can still be lower than in major tech hubs. It’s wise to research industry reports, job boards, and professional networks specific to software engineering to gauge realistic compensation ranges in the local market.
What should I know about moving into St. Louis from out of state?
When moving to St. Louis, consider the timing of the weather—spring and fall are mild, while winter can bring snow. Research pet‑friendly housing policies and local veterinary clinics. Familiarize yourself with utility setup, local tax registration, and driver’s license transfer procedures. It’s also helpful to join online community groups to learn about neighborhood amenities, local services, and moving tips from re...
What is the overall vibe of St. Louis for young professionals?
St. Louis blends urban amenities with accessible suburbs, offering a range of dining, nightlife, and cultural activities. The city’s cost of living is below the national average, which can ease financial pressure. Work‑life balance varies by industry, but many young professionals appreciate the city’s affordable housing, diverse neighborhoods, and growing tech scene. Visiting neighborhoods, attending networking event...
Some answers here were drafted as a starting point and may be out of date. Live in St. Louis? Add your own.
FAQ
Frequently Asked Questions
Senior Care in St. Louis
38 assisted living, nursing & memory care facilities in St. Louis.
 Senior Care
Adult Day Program at Cardinal Ritter Senior Services
St. Louis, MO
 Senior Care
Our Kings and Queens Home Health, LLC
St. Louis, MO
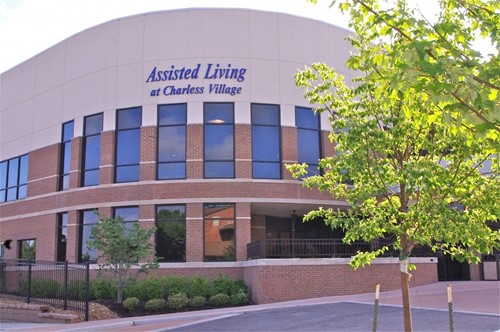 Assisted Living
 at Charless Village
St. Louis, MO
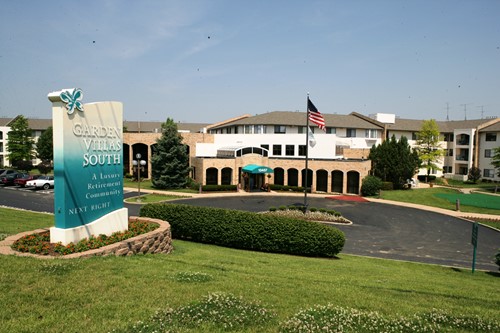 Senior Care
Garden Villas South
St. Louis, MO
 Senior Care
St. Louis Altenheim - Independent, Assisted Living, & Memory...
St. Louis, MO
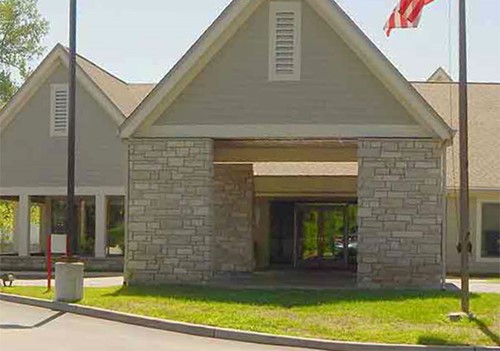 Assisted Living
Ascension Living - Sherbrooke Village - Assisted Living & Me...
St. Louis, MO
 Senior Care
Senior Living at Cambridge Heights
St. Louis, MO
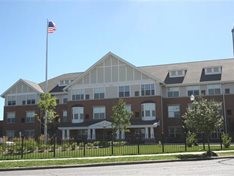 Senior Care
Senior Living at Renaissance Place Apartments
St. Louis, MO
 Assisted Living
Kasey Paige Assisted Living
St. Louis, MO
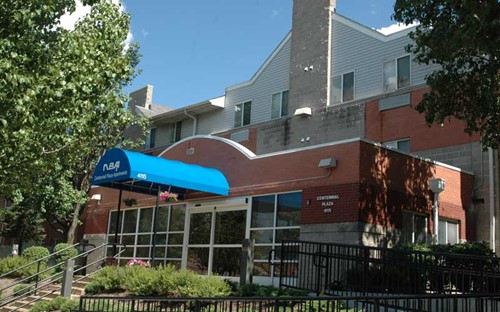 Senior Care
Centennial Plaza
St. Louis, MO
 Assisted Living
Bethesda Hawthorne Place
St. Louis, MO
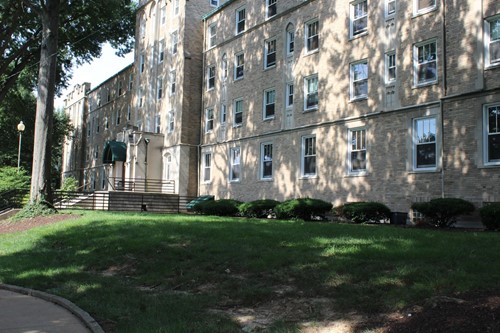 Assisted Living
St. Elizabeth Hall
St. Louis, MO
Free Quotes
Get quotes from local pros in St. Louis
Tell us what you need and we’ll pass it to companies that serve your area. It’s free, and there’s no obligation.

Compare St. Louis with any city
See how it stacks up on cost, income, and quality of life.
Start Comparing