



City Profile
Reno, Nevada
USA · Comprehensive city data and intelligence
Reno, Nevada, known historically as 'The Biggest Little City in the World,' has evolved from a gaming and tourism hub into a diversified economic powerhouse in the high desert of the Truckee Meadows. Nestled at the foot of the Sierra Nevada mountains, the city offers a unique blend of vibrant urban nightlife, historic casino culture, and world-class outdoor recreation. In recent years, Reno has attracted significant numbers of newcomers fleeing high-cost metropolitan areas in California, drawn by a thriving business climate and no state income tax.
Nevada, known as the "Silver State," offers a diverse character ranging from the vibrant entertainment hubs of Las Vegas and Reno to vast desert landscapes and mountainous regions. The economy is primarily driven by tourism and hospitality, gaming, and mining, with growing sectors in technology, healthcare, and renewable energy. Living in Nevada generally involves a competitive cost of living, often lower than neighboring California, and no state income tax, which can lead to higher take-home pay. The climate is largely arid with hot summers, especially in the southern parts, and colder winters with snow in northern areas and mountains, while the lifestyle offers a blend of urban amenities, outdoor recreation, and a generally laid-back, accepting atmosphere.
How this 61/100 was calculated five components, with every reading behind them
| Component | Readings used | Points | Weight | Contributes |
|---|---|---|---|---|
| Safety | Safety score: 68 / 100 | 68.0 | 30% | 20.4 |
| Affordability | Cost of living index (100 = national baseline): 104.0 | 38.8 | 25% | 9.7 |
| Economy & jobs | Median household income: $76,500 Income needed to live here: $58,000 Unemployment rate: 4.5% | 66.8 | 20% | 13.4 |
| Growth | Population growth rate: 1.4% Job growth rate: 2.4% | 64.0 | 15% | 9.6 |
| Business climate assessment | Business climate assessment: 76 / 100 | 76.0 | 10% | 7.6 |
| Overall score | 60.6 | |||
Provenance.
These figures were produced by the research pass recorded as
Tier 1 (fast) (q=52, partial — below threshold), last refreshed
16 October 2026.
They are researched estimates drawn from public sources, not a licensed data feed.
Each component is scored against fixed published endpoints, so this number is comparable with any other city and does not move as the dataset grows. Scoring framework 2026.10 — full methodology, weights and accepted ranges.

Featured Events
Happening in Reno
Featured and sponsored events in Reno.
Local Directory
Businesses in Reno
Featured local businesses in Reno.

Performance
Quality Scores
Expenses
Cost of Living
The cost of living in Reno is higher than the national average, driven largely by significant demand for housing and rapid regional growth over the past decade. While everyday expenses like groceries and utilities hover close to national medians, the influx of new residents and major logistics and technology employers has put upward pressure on both home prices and rental rates. Despite these increases, Reno remains notably more affordable than neighboring major cities in Northern California.
Income
Salary Insights
Reno's economy has transformed dramatically with the establishment of the Tahoe Reno Industrial Center, hosting massive operations for companies like Tesla, Panasonic, Google, and Apple. The region boasts a robust job market spanning advanced manufacturing, technology, logistics, tourism, and healthcare. Additionally, the area supports a growing remote work community and entrepreneurial ecosystem fostered by local university partnerships and incubator programs.
The average salary in Reno is $67,000 per year. You would need approximately $58,000 to live comfortably.
Employment
Top Industries
Weather
Climate
Mobility
Transport
Getting around Reno relies primarily on personal vehicles, though the Regional Transportation Commission (RTC) operates a comprehensive bus network serving the metropolitan area. The city features manageable commute times compared to major coastal metros, though peak traffic can build along major corridors like Interstate 580 and US-395. Walkability varies widely, with dense urban living concentrated downtown and in Midtown, while suburban areas remain largely car-dependent.

At a Glance
Pros & Cons
Advantages
Drawbacks
Community Q&A
Questions about Reno
What people ask about living in and moving to Reno, Nevada.
FAQ
Frequently Asked Questions
Businesses for Sale in Reno
Explore active acquisition & franchise opportunities .
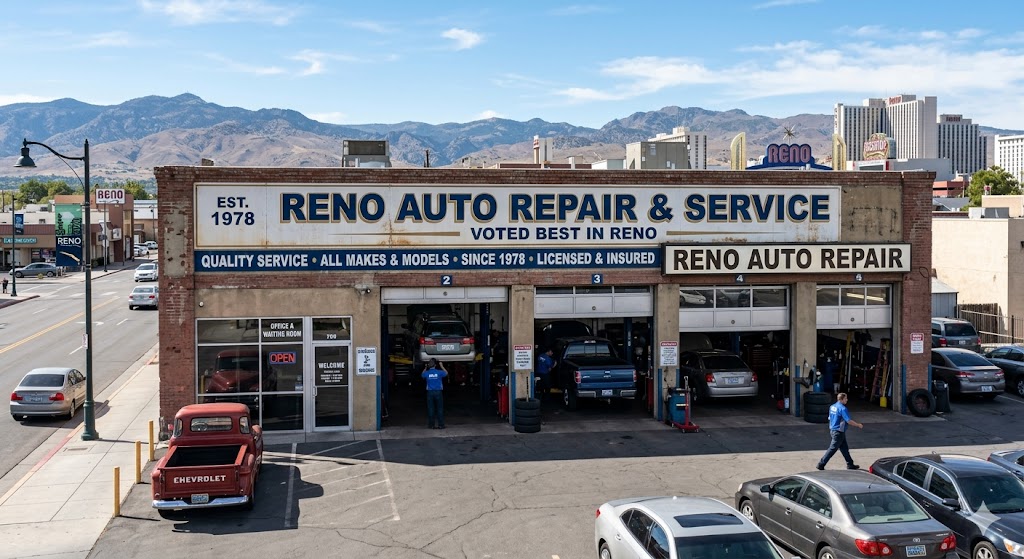
Senior Care in Reno
48 assisted living, nursing & memory care facilities in Reno.
 Senior Care
AARP Senior Community Services
Reno, NV
 Senior Care
Urology Nevada
Reno, NV
 Senior Care
Advanced Health Care of Northern Nevada
Reno, NV
 Senior Care
Advanced Home Health and Hospice of Northern Nevada
Reno, NV
 Senior Care
Revel Rancharrah
Reno, NV
 Senior Care
Lakeside Manor Retirement
Reno, NV
 Senior Care
A Plus Hospice Care
Reno, NV
 Senior Care
Renown Hospice and Palliative Care
Reno, NV
 Senior Care
Eden Health
Reno, NV
 Senior Care
Saint Mary’s Hospice of Northern Nevada
Reno, NV
 Senior Care
Alta Skilled Nursing and Rehabilitation Center
Reno, NV
American Home Companion, Inc
Reno, NV
City Guide
Explore Reno
Free Quotes
Get quotes from local pros in Reno
Tell us what you need and we’ll pass it to companies that serve your area. It’s free, and there’s no obligation.

Compare Reno with any city
See how it stacks up on cost, income, and quality of life.
Start Comparing