



City Profile
Davenport, Iowa
USA · Comprehensive city data and intelligence
Davenport, Iowa, is a vibrant city nestled along the Mississippi River, forming a significant part of the bi-state Quad Cities region. Founded in 1836, the city boasts a rich history and a unique character, known for its open riverfront without permanent flood walls, contributing to a welcoming atmosphere. People are drawn to Davenport for its blend of urban amenities and suburban comfort, offering a lower cost of living and a strong sense of community. The city is recognized for its cultural attractions, extensive recreational opportunities, and a growing food scene, making it an appealing place for both individuals and families seeking an affordable yet dynamic lifestyle.
Iowa, located in the Midwest, is characterized by its expansive farmlands and a generally relaxed, community-focused lifestyle. The state's economy is diverse, with major industries including advanced manufacturing, biosciences, finance and insurance, and its foundational agricultural sector, which leads in corn, soybean, ethanol, and pork production. Living in Iowa is notably affordable, with the cost of living, particularly housing, being significantly lower than the national average. The climate is humid continental, featuring hot, humid summers and cold winters, with seasonal precipitation and susceptibility to various natural disasters like snowstorms, floods, and tornadoes.
How this 51/100 was calculated five components, with every reading behind them
| Component | Readings used | Points | Weight | Contributes |
|---|---|---|---|---|
| Safety | Safety score: 45 / 100 | 45.0 | 30% | 13.5 |
| Affordability | Cost of living index (100 = national baseline): 91.0 | 55.0 | 25% | 13.8 |
| Economy & jobs | Median household income: $66,200 Income needed to live here: $67,000 Unemployment rate: 4.2% | 48.0 | 20% | 9.6 |
| Growth | Population growth rate: no usable reading Job growth rate: 1.68% | 53.6 | 15% | 8.0 |
| Business climate assessment | Business climate assessment: 65 / 100 | 65.0 | 10% | 6.5 |
| Overall score | 51.4 | |||
Provenance.
These figures were produced by the research pass recorded as
Gemini (Tier 2 (reasoned), q=90 ✓ perfect), last refreshed
21 August 2026.
They are researched estimates drawn from public sources, not a licensed data feed.
Each component is scored against fixed published endpoints, so this number is comparable with any other city and does not move as the dataset grows. Scoring framework 2026.10 — full methodology, weights and accepted ranges.

Featured Events
Happening in Davenport
Featured and sponsored events in Davenport.
Local Directory
Businesses in Davenport
Featured local businesses in Davenport.

Performance
Quality Scores
Expenses
Cost of Living
The cost of living in Davenport is notably more affordable than the national average, estimated to be around 9% lower. This affordability is a significant draw for residents, with housing expenses being a primary factor in the lower overall costs. Rent prices, in particular, are considerably below the national average, making it an attractive market for renters. While some costs like transportation might be slightly higher than the national average, groceries and utilities generally remain more affordable, contributing to a manageable cost of living for its residents.
Income
Salary Insights
Davenport's economy is diverse, with key industries including Manufacturing, Health Care & Social Assistance, and Retail Trade, which were the largest employers in 2024. The city's employment landscape saw a growth rate of 1.68% from 2023 to 2024, indicating a steady job market. While the Quad Cities metro area experienced some job losses in recent months of 2026, sectors like education and health services have shown consistent growth. The presence of major employers like Genesis Health System and educational institutions such as St. Ambrose University and Palmer College of Chiropractic contribute to a stable job environment.
The average salary in Davenport is $38,673 per year. You would need approximately $67,000 to live comfortably.
Employment
Top Industries
Weather
Climate
Mobility
Transport
Getting around Davenport primarily relies on personal vehicles, with a significant majority of residents driving alone to work. The average one-way commute time is approximately 19.4 minutes, which is shorter than the national average. While the city has a Walk Score of 44, indicating that most errands require a car, some neighborhoods like Downtown and Gold Coast are more pedestrian-friendly. Public transit options are available through Davenport Citibus, but the overall car dependency remains medium to high due to limited bike lanes and the necessity of a car for many daily activities.

At a Glance
Pros & Cons
Advantages
Drawbacks
Head to Head
Compare Davenport
Community Q&A
Questions about Davenport
What people ask about living in and moving to Davenport, Iowa.
FAQ
Frequently Asked Questions
Businesses for Sale in Davenport
Explore active acquisition & franchise opportunities .

Senior Care in Davenport
31 assisted living, nursing & memory care facilities in Davenport.
 Senior Care
Center For Active Seniors
Davenport, IA
 Senior Care
Davenport Lutheran Home Communities
Davenport, IA
 Senior Care
CASI : Center For Active Senior, Inc
Davenport, IA
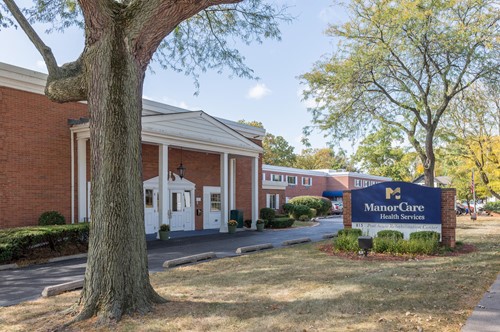 Assisted Living
Manorcare Health Services
Davenport, IA
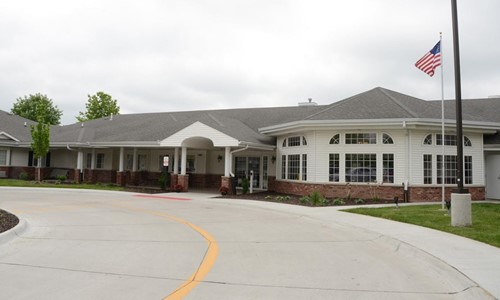 Senior Care
Silvercrest at Garner
Davenport, IA
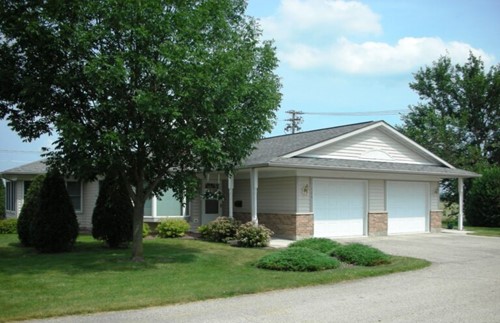 Senior Care
Davenport Lutheran Home - Independent Living Duplex Townhome...
Davenport, IA
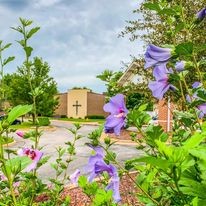 Assisted Living
Davenport Lutheran Home - Assisted Living
Davenport, IA
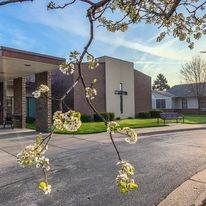 Assisted Living
Davenport Lutheran Home
Davenport, IA
 Assisted Living
Country Manor Memory Care
Davenport, IA
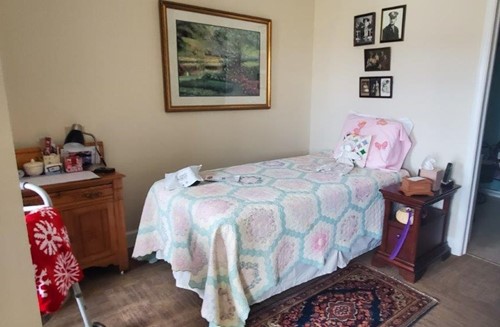 Assisted Living
Ridgecrest Village - Oakwood Assisted Living
Davenport, IA
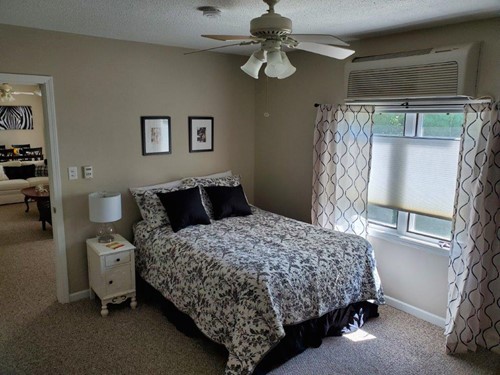 Senior Care
Ridgecrest Village - Apartments
Davenport, IA
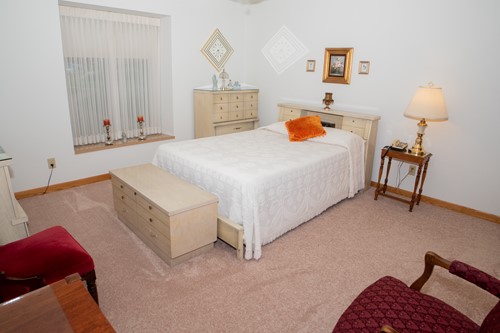 Senior Care
Ridgecrest Village - Cottages Independent Living
Davenport, IA
City Guide
Explore Davenport
Free Quotes
Get quotes from local pros in Davenport
Tell us what you need and we’ll pass it to companies that serve your area. It’s free, and there’s no obligation.

Compare Davenport with any city
See how it stacks up on cost, income, and quality of life.
Start Comparing