



City Profile
Overland Park, Kansas
USA · Comprehensive city data and intelligence
Overland Park, Kansas, founded in 1905 by William B. Strang Jr., has grown from a suburban subdivision into the second-most populous city in the state. Located in Johnson County as part of the Kansas City metropolitan area, the city is widely recognized for its planned neighborhoods, extensive park systems, and robust economic foundation. Residents are drawn to the area for its exceptional public schools, clean suburban aesthetic, and thriving commercial centers like Oak Park Mall and downtown Overland Park.
The community places a strong emphasis on community engagement, green spaces—such as the Overland Park Arboretum and Botanical Gardens—and a family-friendly atmosphere. Over the decades, it has evolved into a dynamic business hub that attracts major corporate headquarters while maintaining quiet, tree-lined residential neighborhoods. Its strategic midwestern location provides a balanced blend of big-city amenities and suburban comfort.
Kansas, known as the "Sunflower State," offers a blend of rural charm and urban development, characterized by friendly communities and a relaxed pace of life. Its economy is diverse, with major industries including agriculture (a leading producer of wheat, corn, and sorghum), aerospace, advanced manufacturing, and professional services. Living in Kansas is generally affordable, with a cost of living approximately 10-15% lower than the national average, particularly for housing. The state experiences four distinct seasons with warm to hot summers, mild to cold winters, and moderate humidity, though it is prone to severe weather like thunderstorms and tornadoes, especially in spring and early summer.
How this 70/100 was calculated five components, with every reading behind them
| Component | Readings used | Points | Weight | Contributes |
|---|---|---|---|---|
| Safety | Safety score: 84 / 100 | 84.0 | 30% | 25.2 |
| Affordability | Cost of living index (100 = national baseline): 102.0 | 41.3 | 25% | 10.3 |
| Economy & jobs | Median household income: $95,450 Income needed to live here: $58,000 Unemployment rate: 2.8% | 95.0 | 20% | 19.0 |
| Growth | Population growth rate: 0.8% Job growth rate: 1.8% | 50.5 | 15% | 7.6 |
| Business climate assessment | Business climate assessment: 79 / 100 | 79.0 | 10% | 7.9 |
| Overall score | 70.0 | |||
Provenance.
These figures were produced by the research pass recorded as
Tier 1 (fast) (q=52, partial — below threshold), last refreshed
16 October 2026.
They are researched estimates drawn from public sources, not a licensed data feed.
Each component is scored against fixed published endpoints, so this number is comparable with any other city and does not move as the dataset grows. Scoring framework 2026.10 — full methodology, weights and accepted ranges.

Featured Events
Happening in Overland Park
Featured and sponsored events in Overland Park.
Local Directory
Businesses in Overland Park
Featured local businesses in Overland Park.

Performance
Quality Scores
Expenses
Cost of Living
The cost of living in Overland Park is slightly above the national average, largely driven by housing demand, premium school districts, and high quality-of-service infrastructure. While everyday expenses like groceries and utilities track relatively close to national benchmarks, real estate and property taxes reflect the desirability of the region's top-tier neighborhoods. Higher median household incomes in Johnson County help absorb these elevated costs, making the city an accessible yet upscale option for professionals and families.
Compared to coastal metropolitan areas, Overland Park offers competitive value for money, providing spacious suburban housing, low crime rates, and modern municipal amenities. While rental markets and home purchase prices have appreciated steadily, they remain more manageable than those in primary coastal hubs while maintaining a high standard of living.
Income
Salary Insights
Overland Park serves as a premier economic engine within the Kansas City metropolitan area, featuring a diverse corporate base anchored by healthcare, technology, financial services, and telecommunications. Major employers such as Black & Veatch, Sprint/T-Mobile legacy operations, and Shawnee Mission School District provide robust employment opportunities across engineering, corporate management, and education. The city's pro-business climate has fostered a thriving startup ecosystem and a strong entrepreneurial community supported by local incubators and coworking spaces.
Remote work is also prevalent among the city's highly educated workforce, with many residents commuting flexibly or telecommuting for regional and national firms. Job growth rates remain steady, supported by continuous commercial development along the Interstate 435 corridor and continuous investments in professional infrastructure.
The average salary in Overland Park is $78,000 per year. You would need approximately $58,000 to live comfortably.
Employment
Top Industries
Weather
Climate
Mobility
Transport
Transportation in Overland Park is primarily centered around automobile travel, with a well-designed grid system and efficient access to major regional highways including I-435, I-35, and US-69. While car dependency is high, the city has made targeted investments in pedestrian pathways, bike lanes, and micro-mobility options, particularly around commercial districts. Public transit is provided via RideKC bus routes connecting to the broader Kansas City metro area.
Average commute times remain reasonable compared to major coastal metros, typically hovering around 20 to 25 minutes. Continuous road improvements and traffic management systems help mitigate congestion during peak morning and evening hours.

At a Glance
Pros & Cons
Advantages
Drawbacks
Head to Head
Compare Overland Park
Community Q&A
Questions about Overland Park
What people ask about living in and moving to Overland Park, Kansas.
FAQ
Frequently Asked Questions
Businesses for Sale in Overland Park
Explore active acquisition & franchise opportunities .

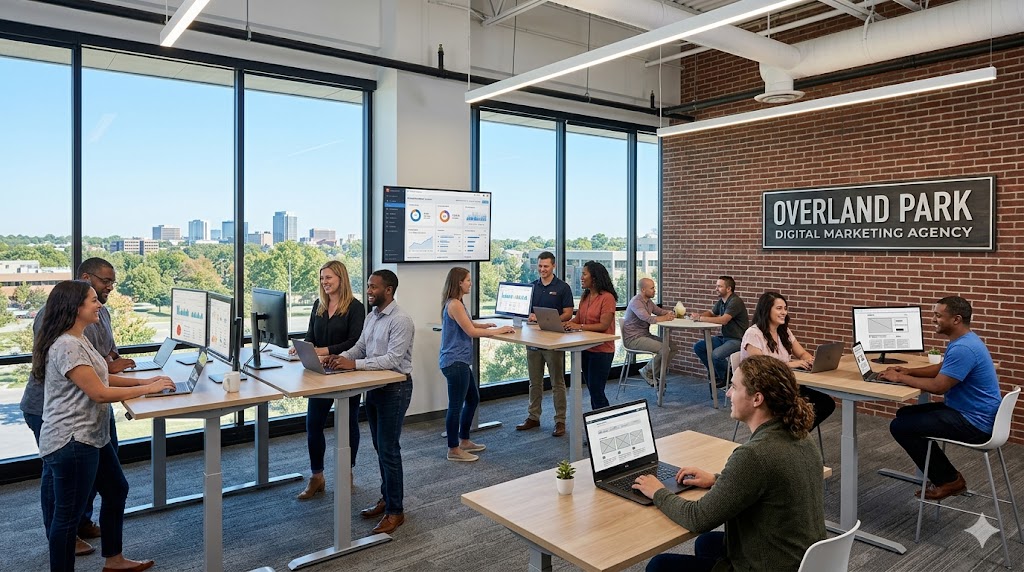
Senior Care in Overland Park
75 assisted living, nursing & memory care facilities in Overland Park.
 Senior Care
Stratford Commons Memory Care Community
Overland Park, KS
 Senior Care
Ascension Living St. Joseph Place
Overland Park, KS
 Senior Care
Allegro - Alto Overland Park, KS
Overland Park, KS
 Senior Care
Benefits of Home Senior care
Overland Park, KS
 Senior Care
KC Concierge Services
Overland Park, KS
 Senior Care
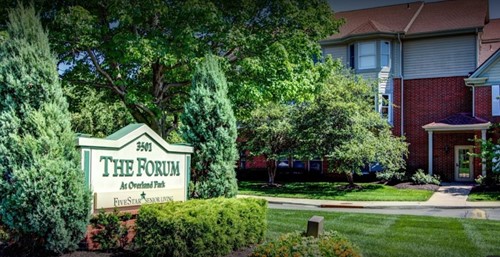
The Forum at Overland Park
Overland Park, KS
 Assisted Living
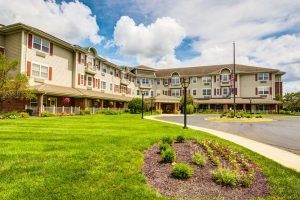
Glenwood Village of Overland Park
Overland Park, KS
 Assisted Living
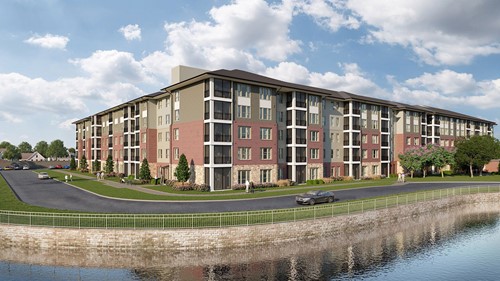
Tallgrass Creek Continuing Care
Overland Park, KS
 Senior Care
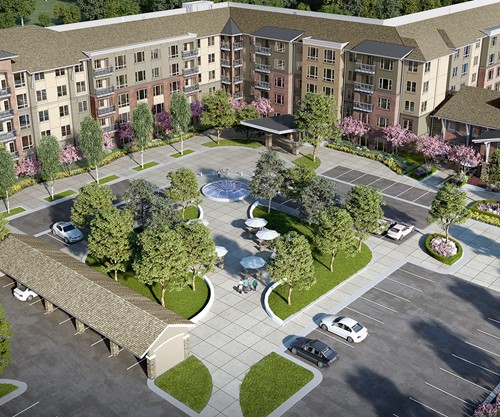
Tallgrass Creek Independent Living
Overland Park, KS
 Assisted Living
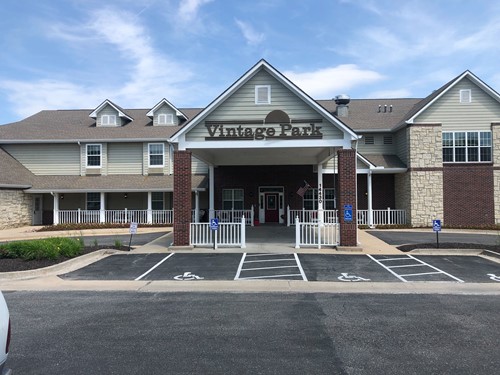
Vintage Park at Stanley
Overland Park, KS
 Assisted Living
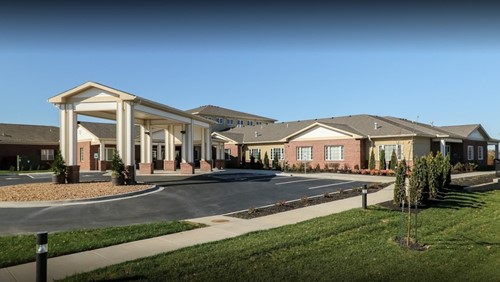
Stratford Commons Rehab & Health Care Center
Overland Park, KS
 Assisted Living
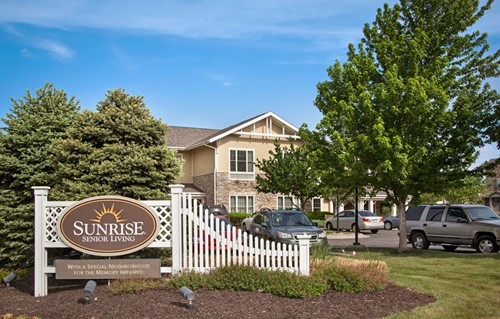
Sunrise of Overland Park
Overland Park, KS
City Guide
Explore Overland Park
Free Quotes
Get quotes from local pros in Overland Park
Tell us what you need and we’ll pass it to companies that serve your area. It’s free, and there’s no obligation.

Compare Overland Park with any city
See how it stacks up on cost, income, and quality of life.
Start Comparing