



City Profile
Gorham, Maine
USA · Comprehensive city data and intelligence
Gorham is a historic and fast-growing town located in Cumberland County, Maine, originally settled in 1736 and incorporated in 1764. Known for blending a rich agricultural heritage with a burgeoning village center, it serves as an attractive residential and commercial hub in Southern Maine. It is notably home to one of the campuses of the University of Southern Maine, infusing the area with a vibrant college-town energy while preserving its traditional New England character.
Maine, known for its rugged coastline and vast forests, offers a lifestyle that prioritizes a slower pace and access to nature. The economy is diverse, with major industries including forest products, marine/aquaculture, food/agriculture, outdoor recreation, and manufacturing, alongside growing sectors like life sciences. While the cost of living is generally moderate compared to other New England states, housing costs can be higher in popular coastal areas like Portland. The climate features warm, sometimes humid summers and long, cold, and very snowy winters, especially inland, with coastal areas experiencing slightly milder temperatures.
How this 72/100 was calculated five components, with every reading behind them
| Component | Readings used | Points | Weight | Contributes |
|---|---|---|---|---|
| Safety | Safety score: 82 / 100 | 82.0 | 30% | 24.6 |
| Affordability | Cost of living index (100 = national baseline): 108.0 | 33.8 | 25% | 8.4 |
| Economy & jobs | Median household income: $112,312 Income needed to live here: $60,000 Unemployment rate: 2.4% | 97.5 | 20% | 19.5 |
| Growth | Population growth rate: 3.41% Job growth rate: 2.1% | 81.0 | 15% | 12.2 |
| Business climate assessment | Business climate assessment: 72 / 100 | 72.0 | 10% | 7.2 |
| Overall score | 71.9 | |||
Provenance.
These figures were produced by the research pass recorded as
Gemini (ungrounded) (q=55, partial — below threshold), last refreshed
17 October 2026.
They are researched estimates drawn from public sources, not a licensed data feed.
Each component is scored against fixed published endpoints, so this number is comparable with any other city and does not move as the dataset grows. Scoring framework 2026.10 — full methodology, weights and accepted ranges.

Featured Events
Happening in Gorham
Featured and sponsored events in Gorham.
Local Directory
Businesses in Gorham
Featured local businesses in Gorham.

Performance
Quality Scores
Expenses
Cost of Living
The cost of living in Gorham tends to run slightly above the national average, driven largely by high demand for suburban and small-town housing near the Portland metropolitan area. While utility and transportation costs remain relatively close to regional baselines, overall expenses are elevated due to climbing property values and competitive rental markets. Everyday goods and services align closely with broader New England standards.
Income
Salary Insights
Gorham’s economy is supported by a diversified mix of manufacturing, construction, warehouse distribution, and higher education. The Gorham Industrial Park acts as a major regional engine for employment, alongside growing craft beverage and localized service sectors. Proximity to Portland enables a steady stream of remote and hybrid workers who appreciate the local entrepreneurial climate and small-business support.
The average salary in Gorham is $72,000 per year. You would need approximately $60,000 to live comfortably.
Employment
Top Industries
Weather
Climate
Mobility
Transport
Gorham is primarily a car-dependent community, with most residents driving alone to work via local routes connecting to the Maine Turnpike. The average commute time sits around 30 minutes as workers travel toward Portland and surrounding employment centers. Public transit options are limited, though localized walkability is high directly within the historic village center.

At a Glance
Pros & Cons
Advantages
Drawbacks
Head to Head
Compare Gorham
Community Q&A
Questions about Gorham
What people ask about living in and moving to Gorham, Maine.
FAQ
Frequently Asked Questions
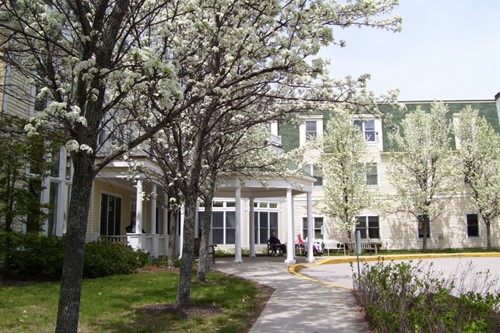
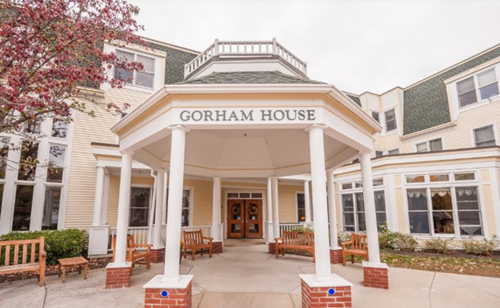
Senior Care in Gorham
4 assisted living, nursing & memory care facilities in Gorham.
Free Quotes
Get quotes from local pros in Gorham
Tell us what you need and we’ll pass it to companies that serve your area. It’s free, and there’s no obligation.

Compare Gorham with any city
See how it stacks up on cost, income, and quality of life.
Start Comparing