



City Profile
Brick, New Jersey
USA · Comprehensive city data and intelligence
Brick Township, located in Ocean County, New Jersey, is a sprawling suburban community known for its extensive waterways, proximity to the Jersey Shore, and family-friendly neighborhoods. Originally established as an industrial hub centered around bog iron and shipbuilding, the township has evolved into a primarily residential destination. Today, it offers residents a blend of coastal charm and suburban convenience, situated just minutes from barrier island beaches like Mantoloking and Point Pleasant.
New Jersey, known as the "Garden State," offers a diverse character ranging from dense urban areas to charming suburban towns and rural landscapes. Its robust economy, with a GDP of over $815 billion, is driven by major industries such as pharmaceuticals and life sciences, financial services, technology, advanced manufacturing, and transportation and logistics. Living in New Jersey is generally more expensive than the national average, with housing costs being a primary factor. The state experiences a humid subtropical climate across most of its area, characterized by warm, humid summers and moderately cold, occasionally snowy winters, with distinct seasonal changes. Residents enjoy a lifestyle that balances proximity to major metropolitan areas like New York City and Philadelphia with access to beaches, mountains, and various recreational opportunities.
How this 60/100 was calculated five components, with every reading behind them
| Component | Readings used | Points | Weight | Contributes |
|---|---|---|---|---|
| Safety | Safety score: 82 / 100 | 82.0 | 30% | 24.6 |
| Affordability | Cost of living index (100 = national baseline): 118.0 | 21.3 | 25% | 5.3 |
| Economy & jobs | Median household income: $94,850 Income needed to live here: $62,000 Unemployment rate: 4.2% | 81.9 | 20% | 16.4 |
| Growth | Population growth rate: 0.4% Job growth rate: 1.5% | 42.5 | 15% | 6.4 |
| Business climate assessment | Business climate assessment: 70 / 100 | 70.0 | 10% | 7.0 |
| Overall score | 59.7 | |||
Provenance.
These figures were produced by the research pass recorded as
Gemini (ungrounded) (q=54, partial — below threshold), last refreshed
16 October 2026.
They are researched estimates drawn from public sources, not a licensed data feed.
Each component is scored against fixed published endpoints, so this number is comparable with any other city and does not move as the dataset grows. Scoring framework 2026.10 — full methodology, weights and accepted ranges.

Featured Events
Happening in Brick
Featured and sponsored events in Brick.
Local Directory
Businesses in Brick
Featured local businesses in Brick.

Performance
Quality Scores
Expenses
Cost of Living
The cost of living in Brick is moderately higher than the national average, driven largely by housing demand and New Jersey's general property tax structure. While everyday expenses like groceries and utilities align closely with regional norms, housing and real estate costs remain elevated due to the town's desirable coastal location. Residents benefit from being near major commercial corridors along Route 70 and Route 88, which offer ample shopping and dining choices that help offset some daily expenses.
Income
Salary Insights
Brick's local economy is anchored by retail trade, healthcare services, educational systems, and tourism-related hospitality. Major regional employers include Hackensack Meridian Health's Ocean Medical Center and the local public school district, providing stable employment options. Many residents also commute to nearby commercial hubs like New York City, Philadelphia, or Trenton via nearby transit options or major highways like the Garden State Parkway.
The average salary in Brick is $68,000 per year. You would need approximately $62,000 to live comfortably.
Employment
Top Industries
Weather
Climate
Mobility
Transport
Brick is a heavily car-dependent community where most daily errands require driving along major arteries like Route 70, Route 88, and the Garden State Parkway. Public transit is somewhat limited compared to northern New Jersey, though NJ Transit bus routes connect commuters to regional hubs. The nearest train stations are located in neighboring towns like Point Pleasant Beach and Manasquan, offering rail access to NYC.

At a Glance
Pros & Cons
Advantages
Drawbacks
Head to Head
Compare Brick
Community Q&A
Questions about Brick
What people ask about living in and moving to Brick, New Jersey.
FAQ
Frequently Asked Questions
Senior Care in Brick
13 assisted living, nursing & memory care facilities in Brick.
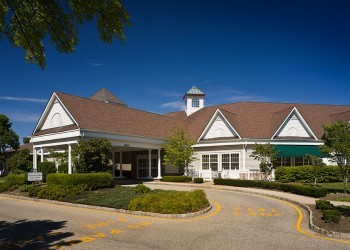 Assisted Living
Complete Care At Shorrock
Brick, NJ
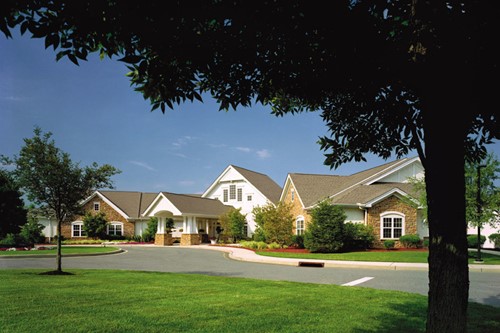 Assisted Living
Brandywine Living at Reflections at Brick
Brick, NJ
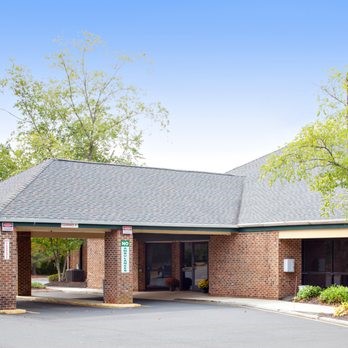 Assisted Living
Complete Care At Laurelton, LLC
Brick, NJ
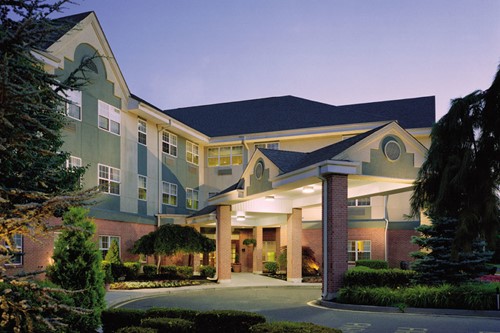 Assisted Living
Brandywine Living at the Gables
Brick, NJ
 Assisted Living
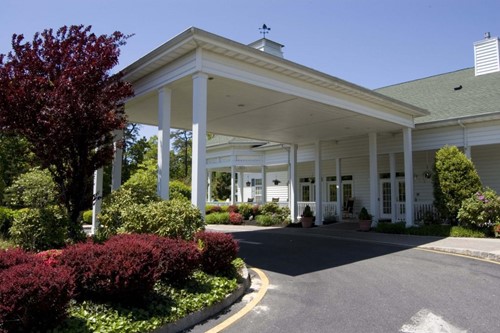
The Chelsea at Brick
Brick, NJ
 Assisted Living
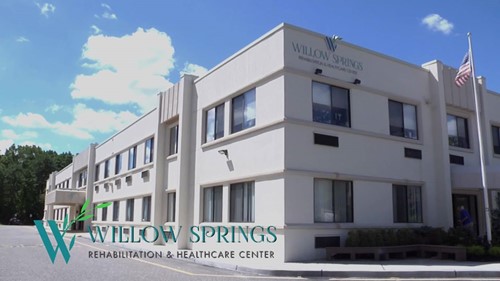
Willow Springs Rehabilitation And Healthcare Center
Brick, NJ
Visiting Angels - Toms River
Brick, NJ
BrightStar Care - Northern Ocean County
Brick, NJ
Affinity Care Of Nj, LLC
Brick, NJ
Hackensack Meridian At Home Ocean County
Brick, NJ
Right at Home - Ocean County
Brick, NJ
Meridian Nursing And Rehabilitation At Brick
Brick, NJ
City Guide
Explore Brick
Free Quotes
Get quotes from local pros in Brick
Tell us what you need and we’ll pass it to companies that serve your area. It’s free, and there’s no obligation.

Compare Brick with any city
See how it stacks up on cost, income, and quality of life.
Start Comparing