



City Profile
Springfield, Ohio
USA · Comprehensive city data and intelligence
Springfield, Ohio, is a city with a rich industrial past that is actively working towards a revitalized future. Originally a hub for manufacturing, the city has faced economic challenges but is now focusing on downtown revitalization, attracting new residents, and fostering a stronger community spirit. Its strategic location along I-70, between Dayton and Columbus, makes it an accessible base for commuters and a potential growth area for those seeking more affordable living. Springfield's character is shaped by its history, its ongoing efforts to attract a diverse population, and its commitment to improving quality of life through community initiatives and development projects.
Ohio, located in the Midwest, is characterized by a blend of urban centers and rural landscapes, offering a balance of city amenities and small-town charm. The state's economy is robust and diverse, with manufacturing being a significant sector, particularly in plastics, rubber, fabricated metals, and automobiles. Other major industries include financial activities, healthcare, education, and bioscience, with growing technology and logistics sectors. Living in Ohio is generally affordable, with the cost of living, especially housing, being lower than the national average. The climate is continental, featuring four distinct seasons with hot, humid summers and cold, snowy winters, and precipitation occurring year-round.
How this 54/100 was calculated five components, with every reading behind them
| Component | Readings used | Points | Weight | Contributes |
|---|---|---|---|---|
| Safety | Safety score: 30 / 100 | 30.0 | 30% | 9.0 |
| Affordability | Cost of living index (100 = national baseline): 85.0 | 62.5 | 25% | 15.6 |
| Economy & jobs | Median household income: $47,143 Income needed to live here: $33,240 Unemployment rate: 4% | 76.1 | 20% | 15.2 |
| Growth | No usable reading — dataset average used | 56.4 | 15% | 8.5 |
| Business climate assessment | Business climate assessment: 60 / 100 | 60.0 | 10% | 6.0 |
| Overall score | 54.3 | |||
Provenance.
These figures were produced by the research pass recorded as
Tier 1 (fast) (q=62, partial — below threshold), last refreshed
30 August 2026.
They are researched estimates drawn from public sources, not a licensed data feed.
Each component is scored against fixed published endpoints, so this number is comparable with any other city and does not move as the dataset grows. Scoring framework 2026.10 — full methodology, weights and accepted ranges.

Featured Events
Happening in Springfield
Featured and sponsored events in Springfield.
Local Directory
Businesses in Springfield
Featured local businesses in Springfield.

Performance
Quality Scores
Expenses
Cost of Living
Springfield offers a cost of living that is notably lower than the national average, making it an attractive option for budget-conscious individuals and families. Housing costs are a significant driver of this affordability, with home values and average rents substantially below national figures. This lower cost extends to everyday expenses, including groceries and utilities, allowing residents' incomes to stretch further. While the median household income is below the national average, the significantly lower cost of living helps to balance this, providing a comfortable lifestyle for many.
Income
Salary Insights
The economy of Springfield has historically been rooted in manufacturing, though it has diversified to include healthcare and education. Major employers include Navistar International, Springfield Regional Medical Center, and Wittenberg University. The city has seen recent growth fueled in part by an influx of manufacturing and blue-collar jobs, attracting a significant Haitian immigrant population seeking employment. However, the city's economic recovery has been uneven, with some sectors experiencing growth while others, like retail, have faced challenges, such as the closure of the Upper Valley Mall. The proximity to Wright-Patterson Air Force Base also contributes to regional employment opportunities for Springfield commuters.
The average salary in Springfield is $49,276 per year. You would need approximately $33,240 to live comfortably.
Employment
Top Industries
Weather
Climate
Mobility
Transport
Springfield is a car-dependent city, with a very low walkability score and a high reliance on personal vehicles for transportation. The average commute time is around 21.2 minutes, with most residents driving alone to work. Public transportation options are limited, and the city's infrastructure is not designed for extensive pedestrian or cycling activity. This car-centric nature is reflected in its low transit and walkability scores.

At a Glance
Pros & Cons
Advantages
Drawbacks
Head to Head
Compare Springfield
Community Q&A
Questions about Springfield
What people ask about living in and moving to Springfield, Ohio.
FAQ
Frequently Asked Questions
Businesses for Sale in Springfield
Explore active acquisition & franchise opportunities .
 Independent
Profitable Auto Repair Shop for Sale – Springfield
Springfield, Missouri
 Business for Sale
Retail Convenience Store for Sale – Springfield
Springfield, Massachusetts
 Independent
Retail Grocery Store for Sale – Springfield
Springfield, Illinois
Senior Care in Springfield
48 assisted living, nursing & memory care facilities in Springfield.
 Assisted Living
Springfield Masonic Community
Springfield, OH
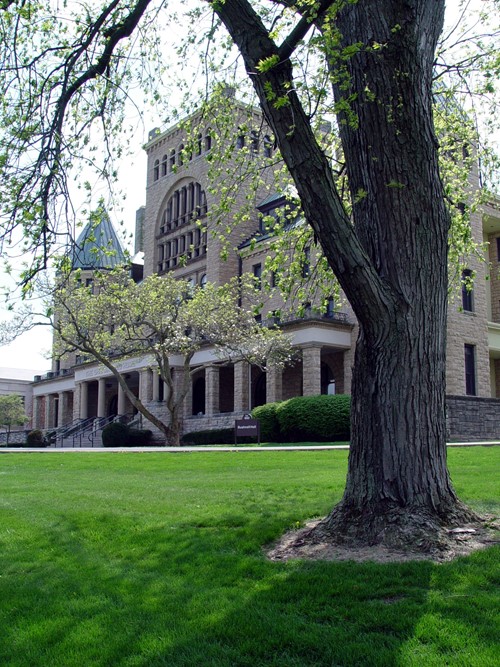 Senior Care
Springfield Masonic Community Senior Living
Springfield, OH
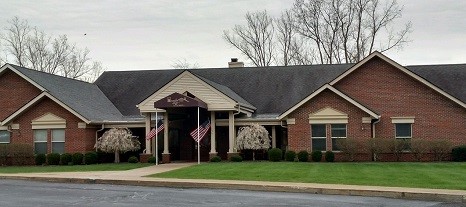 Assisted Living
Hearth & Home at Harding
Springfield, OH
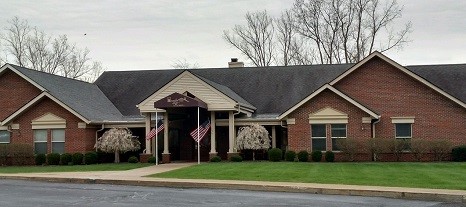 Assisted Living
Hearth & Home at El Camino
Springfield, OH
Assisted Living
Springfield Masonic Community
Springfield, OH
Senior Care
Springfield Masonic Community Senior Living
Springfield, OH
Assisted Living
Hearth & Home at Harding
Springfield, OH
Assisted Living
Hearth & Home at El Camino
Springfield, OH
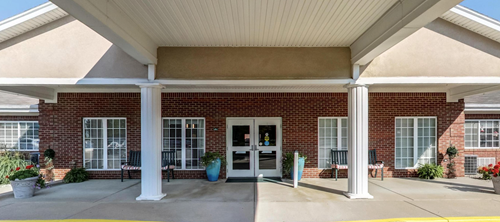 Senior Care
Forest Glen Senior Living
Springfield, OH
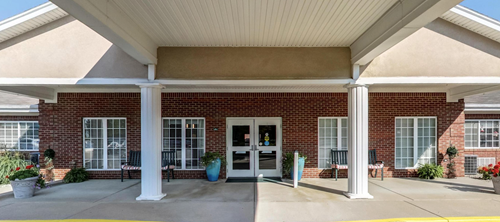 Assisted Living
Forest Glen Health Campus
Springfield, OH
Senior Care
Forest Glen Senior Living
Springfield, OH
Assisted Living
Forest Glen Health Campus
Springfield, OH
City Guide
Explore Springfield
Free Quotes
Get quotes from local pros in Springfield
Tell us what you need and we’ll pass it to companies that serve your area. It’s free, and there’s no obligation.

Compare Springfield with any city
See how it stacks up on cost, income, and quality of life.
Start Comparing