



City Profile
East Providence, Rhode Island
USA · Comprehensive city data and intelligence
East Providence, Rhode Island, is a vibrant and historically rich waterfront city situated along the Seekonk and Providence rivers. Originally inhabited by the Wampanoag people, the area played a significant role in early American history and the industrial development of New England. Today, East Providence offers a unique blend of urban accessibility and suburban neighborhood charm, featuring distinct communities like Rumford, Riverside, and the Waterfront District. Residents are drawn to the city for its scenic parks, excellent recreational access to Narragansett Bay, and its close proximity to downtown Providence.
Rhode Island, the smallest U.S. state, offers a coastal New England lifestyle with a strong sense of community. Its economy is diverse, with major industries including healthcare and social assistance, manufacturing, education, professional and technical services, finance and insurance, and tourism and hospitality. Living in Rhode Island is generally more expensive than the national average, particularly due to higher housing and utility costs, though groceries and healthcare are more in line with national averages. The state experiences a New England climate with cold, snowy winters and warm summers, and its small size means beaches and urban amenities are usually a short drive away.
How this 60/100 was calculated five components, with every reading behind them
| Component | Readings used | Points | Weight | Contributes |
|---|---|---|---|---|
| Safety | Safety score: 74 / 100 | 74.0 | 30% | 22.2 |
| Affordability | Cost of living index (100 = national baseline): 104.0 | 38.8 | 25% | 9.7 |
| Economy & jobs | Median household income: $74,500 Income needed to live here: $58,000 Unemployment rate: 3.9% | 68.4 | 20% | 13.7 |
| Growth | Population growth rate: 0.5% Job growth rate: 1.8% | 46.8 | 15% | 7.0 |
| Business climate assessment | Business climate assessment: 70 / 100 | 70.0 | 10% | 7.0 |
| Overall score | 59.6 | |||
Provenance.
These figures were produced by the research pass recorded as
Tier 1 (fast) (q=54, partial — below threshold), last refreshed
16 October 2026.
They are researched estimates drawn from public sources, not a licensed data feed.
Each component is scored against fixed published endpoints, so this number is comparable with any other city and does not move as the dataset grows. Scoring framework 2026.10 — full methodology, weights and accepted ranges.

Featured Events
Happening in East Providence
Featured and sponsored events in East Providence.
Local Directory
Businesses in East Providence
Featured local businesses in East Providence.

Performance
Quality Scores
Expenses
Cost of Living
The cost of living in East Providence is generally slightly above the national average, yet it often remains more affordable than neighboring Providence or Boston. Housing costs, including both rents and home purchase prices, represent the largest expense for residents, driven by high demand for coastal and near-city real estate. However, everyday expenses such as utilities, groceries, and transportation track relatively close to regional standards, making it an attractive alternative for those working in the greater Providence metropolitan area.
Income
Salary Insights
East Providence benefits from a diversified economy anchored by healthcare, education, retail trade, and manufacturing sectors. Major regional employers are easily accessible, and the city's ongoing revitalization of its Waterfront District has spurred new commercial and residential developments. The local business climate supports a growing number of small enterprises and entrepreneurs, while remote workers appreciate the city's strategic location and reliable digital infrastructure.
The average salary in East Providence is $68,000 per year. You would need approximately $58,000 to live comfortably.
Employment
Top Industries
Weather
Climate
Mobility
Transport
Transportation in East Providence is heavily car-dependent, though the city is served by RIPTA bus routes connecting residents to Providence and surrounding areas. Major thoroughfares like Interstate 195 and Route 44 provide straightforward commuting options for drivers. Walkability varies by neighborhood, with denser commercial areas and new waterfront developments offering more pedestrian-friendly environments.

At a Glance
Pros & Cons
Advantages
Drawbacks
Head to Head
Compare East Providence
Community Q&A
Questions about East Providence
What people ask about living in and moving to East Providence, Rhode Island.
FAQ
Frequently Asked Questions
Senior Care in East Providence
16 assisted living, nursing & memory care facilities in East Providence.
 Senior Care
Aldersbridge Communities
East Providence, RI
 Senior Care
Arbor Hill Assisted Living
East Providence, RI
 Assisted Living
Orchard View Manor
East Providence, RI
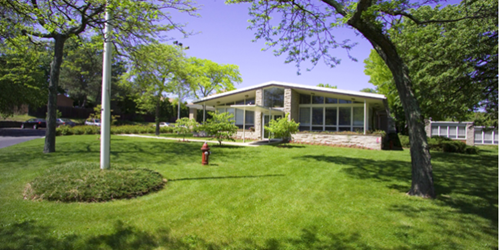 Assisted Living
Hattie Ide Chaffee Home
East Providence, RI
 Assisted Living
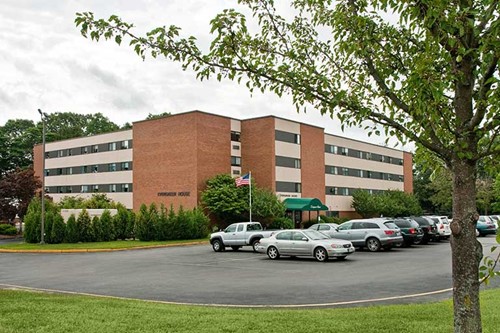
Evergreen House Health Center
East Providence, RI
 Assisted Living
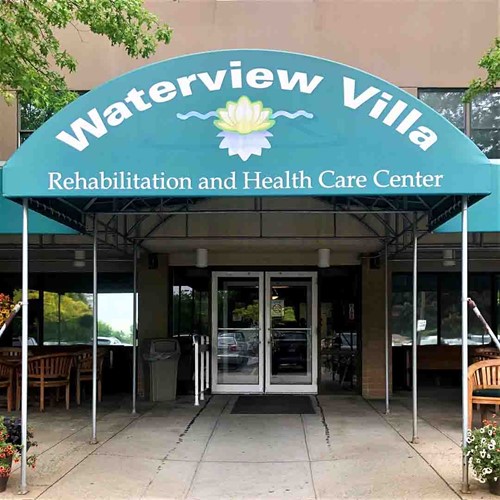
Waterview Villa Rehabilitation And Health Care Cen
East Providence, RI
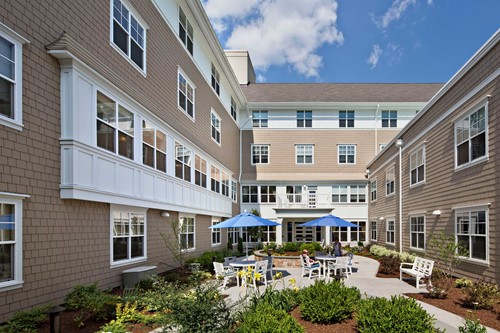 Assisted Living
Tockwotton Assisted Living
East Providence, RI
 Assisted Living
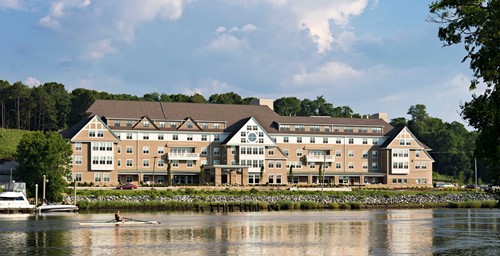
Tockwotton On The Waterfront
East Providence, RI
 Assisted Living
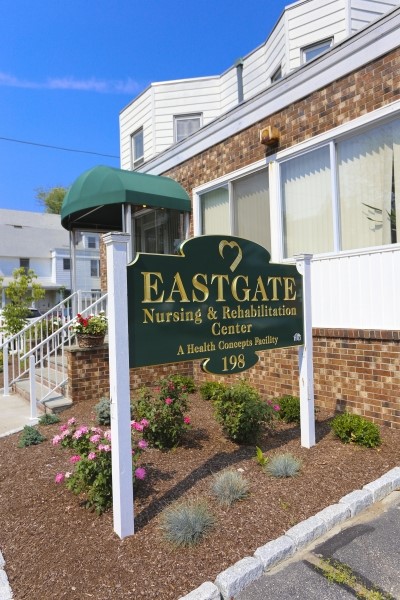
Eastgate Nursing & Rehabilitation Center
East Providence, RI
Assisted Living
Orchard View Manor
East Providence, RI
Assisted Living
Hattie Ide Chaffee Home
East Providence, RI
Assisted Living
Evergreen House Health Center
East Providence, RI
Free Quotes
Get quotes from local pros in East Providence
Tell us what you need and we’ll pass it to companies that serve your area. It’s free, and there’s no obligation.

Compare East Providence with any city
See how it stacks up on cost, income, and quality of life.
Start Comparing