



City Profile
Arlington, Virginia
USA · Comprehensive city data and intelligence
Arlington, Virginia, is a vibrant and densely populated urban county situated directly across the Potomac River from Washington, D.C. Known for its rich history tied to the American Civil War and the founding of the nation's capital, Arlington balances historic landmarks like Arlington National Cemetery with hyper-modern commercial centers. The area has evolved into a premier destination for professionals, families, and government contractors seeking proximity to the federal core combined with neighborhood-scale walkability.
Virginia, a Mid-Atlantic state, offers a diverse character ranging from its historic eastern regions to the Appalachian Mountains in the west. Its economy is well-balanced and diverse, with major industries including professional, scientific, and technical services, healthcare, retail trade, and a significant defense and government contracting sector, particularly in Northern Virginia. While the cost of living can be high in areas like Northern Virginia, it is generally considered moderate statewide, with more affordable options in other regions. The state experiences all four distinct seasons, with warm summers and generally mild winters, and offers a lifestyle that blends urban amenities with abundant outdoor activities and rich historical sites.
How this 62/100 was calculated five components, with every reading behind them
| Component | Readings used | Points | Weight | Contributes |
|---|---|---|---|---|
| Safety | Safety score: 85 / 100 | 85.0 | 30% | 25.5 |
| Affordability | Cost of living index (100 = national baseline): 148.0 | 0.0 | 25% | 0.0 |
| Economy & jobs | Median household income: $137,452 Income needed to live here: $85,000 Unemployment rate: 2.5% | 96.9 | 20% | 19.4 |
| Growth | Population growth rate: 0.8% Job growth rate: 2.4% | 56.5 | 15% | 8.5 |
| Business climate assessment | Business climate assessment: 84 / 100 | 84.0 | 10% | 8.4 |
| Overall score | 61.8 | |||
Provenance.
These figures were produced by the research pass recorded as
Tier 1 (fast) (q=52, partial — below threshold), last refreshed
17 October 2026.
They are researched estimates drawn from public sources, not a licensed data feed.
Each component is scored against fixed published endpoints, so this number is comparable with any other city and does not move as the dataset grows. Scoring framework 2026.10 — full methodology, weights and accepted ranges.

Featured Events
Happening in Arlington
Featured and sponsored events in Arlington.
Local Directory
Businesses in Arlington
Featured local businesses in Arlington.

Performance
Quality Scores
Expenses
Cost of Living
The cost of living in Arlington is significantly higher than the national average, driven primarily by housing demand, high median incomes, and its prime geographic location within the National Capital Region. While everyday goods and services align somewhat closely with metropolitan norms, housing costs for both renters and prospective homeowners require a substantial financial commitment. Residents offset these expenses through robust local earning potentials and access to world-class public amenities.
Income
Salary Insights
Arlington boasts a robust, highly educated economy anchored by federal agencies, defense contractors, technology firms, and professional services. The arrival of major corporate hubs, including Amazon HQ2 in National Landing, has further supercharged the region's commercial growth and innovation ecosystem. Remote and hybrid work are exceptionally common here, supported by a dense network of co-working spaces and high-speed digital infrastructure.
The average salary in Arlington is $95,000 per year. You would need approximately $85,000 to live comfortably.
Employment
Top Industries
Weather
Climate
Mobility
Transport
Arlington is a national model for transit-oriented development, featuring multiple Washington Metro stations, extensive ART bus networks, and an extensive network of protected bike lanes. The county's stellar walkability scores allow many residents to live entirely car-free or car-lite, particularly in the dense urban corridors. Major commuter arteries like I-66 and the George Washington Parkway provide direct access to the broader DMV region.

At a Glance
Pros & Cons
Advantages
Drawbacks
Head to Head
Compare Arlington
Community Q&A
Questions about Arlington
What people ask about living in and moving to Arlington, Virginia.
FAQ
Frequently Asked Questions
Businesses for Sale in Arlington
Explore active acquisition & franchise opportunities .
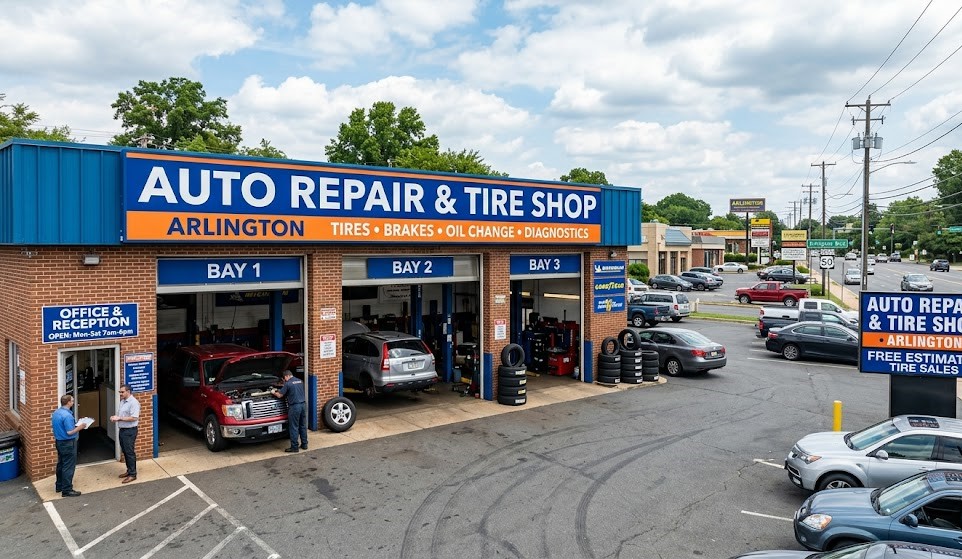
Senior Care in Arlington
14 assisted living, nursing & memory care facilities in Arlington.
 Senior Care
ComForCare Home Care (Arlington, VA)
Arlington, VA
 Assisted Living
ProMedica Skilled Nursing and Rehabilitation - Arlington
Arlington, VA
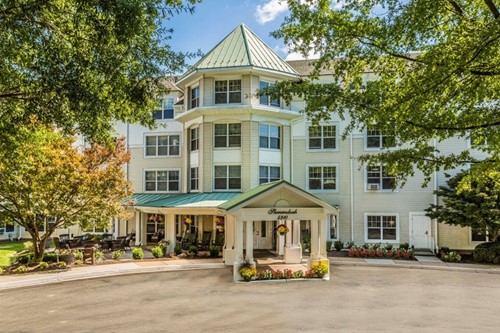 Assisted Living
Sunrise at Bluemont Park
Arlington, VA
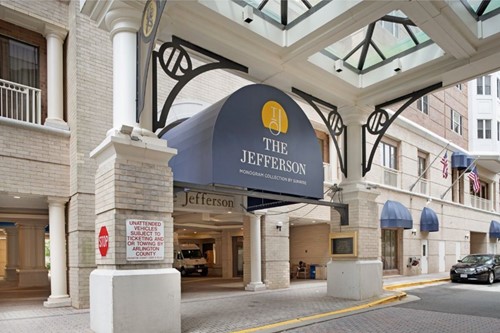 Senior Care
The Jefferson Independent and Assisted Living
Arlington, VA
 Assisted Living
The Jefferson Skilled Nursing
Arlington, VA
 Assisted Living
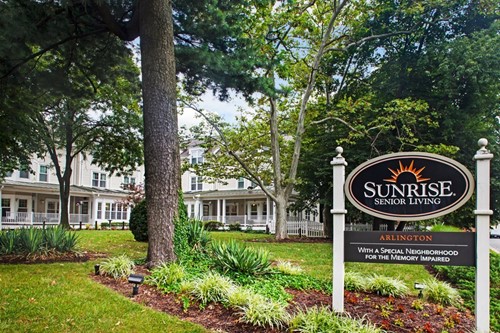
Sunrise of Arlington
Arlington, VA
 Assisted Living
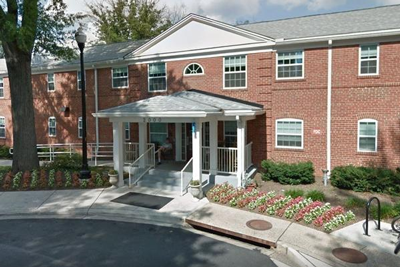
Mary Marshall Assisted Living Residence
Arlington, VA
 Assisted Living
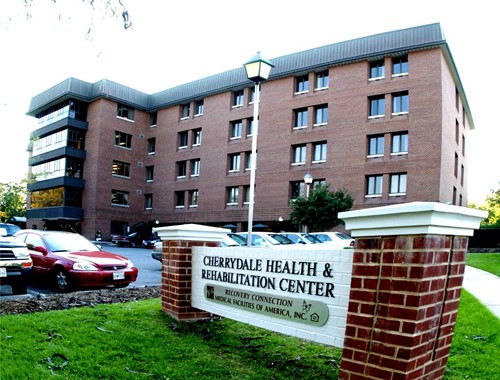
Cherrydale Health And Rehabilitation Center
Arlington, VA
Medstar Health Home Care
Arlington, VA
ComForCare - Arlington
Arlington, VA
Emeritus at Arlington
Arlington, VA
BrightStar Care - Alexandria / Arlington
Arlington, VA
City Guide
Explore Arlington
Free Quotes
Get quotes from local pros in Arlington
Tell us what you need and we’ll pass it to companies that serve your area. It’s free, and there’s no obligation.

Compare Arlington with any city
See how it stacks up on cost, income, and quality of life.
Start Comparing