



City Profile
Castle Rock, Colorado
USA · Comprehensive city data and intelligence
Castle Rock, Colorado, named after its prominent castle-shaped rock outcropping near the center of town, is a vibrant and rapidly expanding home rule municipality serving as the county seat of Douglas County. Founded in 1874 and incorporated in 1881, the town has evolved from a historic mining and railroad hub into one of the most desirable and fastest-growing communities along the Front Range urban corridor. Blending a distinct small-town western charm with modern upscale developments, Castle Rock attracts families and professionals seeking an active lifestyle nestled between Denver and Colorado Springs.
Colorado is characterized by its diverse geography, ranging from the Rocky Mountains to the Eastern Plains, offering a lifestyle that blends natural beauty with community charm and extensive outdoor recreation opportunities. The state's economy is robust and diversified, with major industries including aerospace, bioscience, technology, energy and natural resources, financial services, and a strong tourism sector. Living in Colorado is generally more expensive than the national average, with housing costs being a primary driver. The climate is diverse, featuring four distinct seasons with abundant sunshine, though it can experience rapid weather shifts, including hot summers, cold winters, and occasional extreme weather events like flash floods and strong winds.
How this 70/100 was calculated five components, with every reading behind them
| Component | Readings used | Points | Weight | Contributes |
|---|---|---|---|---|
| Safety | Safety score: 88 / 100 | 88.0 | 30% | 26.4 |
| Affordability | Cost of living index (100 = national baseline): 115.0 | 25.0 | 25% | 6.3 |
| Economy & jobs | Median household income: $145,197 Income needed to live here: $66,996 Unemployment rate: 3.7% | 89.4 | 20% | 17.9 |
| Growth | Population growth rate: 2.72% Job growth rate: 2.5% | 81.5 | 15% | 12.2 |
| Business climate assessment | Business climate assessment: 76 / 100 | 76.0 | 10% | 7.6 |
| Overall score | 70.4 | |||
Provenance.
These figures were produced by the research pass recorded as
Gemini (ungrounded) (q=55, partial — below threshold), last refreshed
11 October 2026.
They are researched estimates drawn from public sources, not a licensed data feed.
Each component is scored against fixed published endpoints, so this number is comparable with any other city and does not move as the dataset grows. Scoring framework 2026.10 — full methodology, weights and accepted ranges.

Featured Events
Happening in Castle Rock
Featured and sponsored events in Castle Rock.
Local Directory
Businesses in Castle Rock
Featured local businesses in Castle Rock.

Performance
Quality Scores
Expenses
Cost of Living
The cost of living in Castle Rock is notably higher than the national average, driven largely by housing demand, high median household incomes, and robust local economic growth. While everyday expenses like groceries and utilities track relatively close to state norms, housing costs—both for purchasing single-family homes and renting apartments—remain well above typical US baselines. This higher cost structure is offset by a booming local economy, low poverty rates, and high average compensation across professional sectors.
Income
Salary Insights
Castle Rock boasts a dynamic and resilient job market anchored by professional, scientific, and technical services, healthcare, retail trade, and education. Major local employers include AdventHealth Castle Rock, the Douglas County School District, and numerous boutique firms, alongside a thriving community of entrepreneurs and remote workers taking advantage of the area's high-tech infrastructure. Job growth remains strong as commercial developments expand within business parks and retail centers like The Meadows and downtown.
The average salary in Castle Rock is $85,000 per year. You would need approximately $66,996 to live comfortably.
Employment
Top Industries
Weather
Climate
Mobility
Transport
Transportation in Castle Rock is predominantly car-dependent, with most residents driving alone or carpooling for their daily commutes along the Interstate 25 corridor. The average commute time sits at approximately 28 minutes, connecting locals to employment centers in Denver, Lone Tree, and the Tech Center. While public transit options are limited compared to core urban centers, the town features developing bike paths and pedestrian networks within its master-planned neighborhoods.

At a Glance
Pros & Cons
Advantages
Drawbacks
Head to Head
Compare Castle Rock
Community Q&A
Questions about Castle Rock
What people ask about living in and moving to Castle Rock, Colorado.
FAQ
Frequently Asked Questions
Senior Care in Castle Rock
21 assisted living, nursing & memory care facilities in Castle Rock.
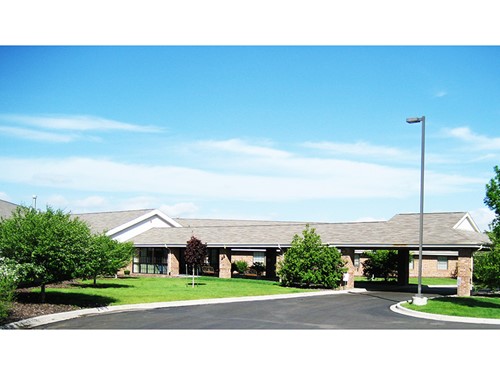 Assisted Living
Brookside Inn
Castle Rock, CO
Colorado Home Health LLC
Castle Rock, CO
Castle Rock Care Center
Castle Rock, CO
Pine Trails at Castle Rock
Castle Rock, CO
Bonaventure of Castle Rock
Castle Rock, CO
Assured Assisted Living 2
Castle Rock, CO
Assured Assisted Living 3
Castle Rock, CO
Assured Assisted Living 4
Castle Rock, CO
Assured Assisted Living 5
Castle Rock, CO
Assured Assisted Living 1
Castle Rock, CO
Solange at the Woodlands Assisted Living
Castle Rock, CO
Comfort Keepers - Castle Rock
Castle Rock, CO
Free Quotes
Get quotes from local pros in Castle Rock
Tell us what you need and we’ll pass it to companies that serve your area. It’s free, and there’s no obligation.

Compare Castle Rock with any city
See how it stacks up on cost, income, and quality of life.
Start Comparing