



City Profile
Rio Rancho, New Mexico
USA · Comprehensive city data and intelligence
Rio Rancho is New Mexico's third-largest city, rapidly evolving from a master-planned retirement and suburban community into a dynamic urban center in Sandoval County. Situated just northwest of Albuquerque, the city offers expansive views of the Sandia Mountains and the Rio Grande Valley. Residents are drawn to the area for its sunny desert climate, family-friendly atmosphere, and lower cost of living compared to many coastal metropolitan areas.
New Mexico, known as "the Land of Enchantment," offers a unique blend of Native American, Spanish, and Mexican cultures, reflected in its architecture, cuisine, and traditions. The state's economy is driven by diverse sectors including energy (oil, gas, and renewables), aerospace and defense, food processing, agriculture, and a significant tourism industry. Living in New Mexico generally offers a lower cost of living compared to the national average, with housing and utilities often more affordable. The climate is largely arid and sunny, with diverse landscapes ranging from deserts to alpine forests, providing for warm to hot summers and cold winters, and a relaxed, outdoor-oriented lifestyle.
How this 66/100 was calculated five components, with every reading behind them
| Component | Readings used | Points | Weight | Contributes |
|---|---|---|---|---|
| Safety | Safety score: 75 / 100 | 75.0 | 30% | 22.5 |
| Affordability | Cost of living index (100 = national baseline): 98.0 | 46.3 | 25% | 11.6 |
| Economy & jobs | Median household income: $74,000 Income needed to live here: $52,000 Unemployment rate: 4.2% | 75.2 | 20% | 15.0 |
| Growth | Population growth rate: 1.8% Job growth rate: 2.4% | 69.0 | 15% | 10.4 |
| Business climate assessment | Business climate assessment: 68 / 100 | 68.0 | 10% | 6.8 |
| Overall score | 66.3 | |||
Provenance.
These figures were produced by the research pass recorded as
Gemini (ungrounded) (q=54, partial — below threshold), last refreshed
15 October 2026.
They are researched estimates drawn from public sources, not a licensed data feed.
Each component is scored against fixed published endpoints, so this number is comparable with any other city and does not move as the dataset grows. Scoring framework 2026.10 — full methodology, weights and accepted ranges.

Featured Events
Happening in Rio Rancho
Featured and sponsored events in Rio Rancho.
Local Directory
Businesses in Rio Rancho
Featured local businesses in Rio Rancho.

Performance
Quality Scores
Expenses
Cost of Living
The cost of living in Rio Rancho remains slightly below the national average, making it an attractive destination for families and retirees alike. Housing costs, while rising due to regional demand, are still more affordable than in nearby Albuquerque or national hotspots. Everyday expenses such as utilities, groceries, and transportation track close to or moderately below standard U.S. benchmarks.
Income
Salary Insights
Rio Rancho's economy is anchored by healthcare, retail trade, manufacturing, and public administration, benefiting from its proximity to the greater Albuquerque employment hub. Major employers like Intel and local healthcare networks provide stable high-tech and medical employment opportunities for residents. The city has actively fostered a business-friendly environment to encourage small business startups and commercial expansion along major corridors like Unser Boulevard.
The average salary in Rio Rancho is $65,000 per year. You would need approximately $52,000 to live comfortably.
Employment
Top Industries
Weather
Climate
Mobility
Transport
Rio Rancho is a heavily car-dependent city where most residents rely on personal vehicles to navigate its sprawling grid layout and commute to jobs in Albuquerque. Commute times average around 25 to 28 minutes, aided by major thoroughfares like NM-528 and Unser Boulevard. Public transit options are limited, though regional bus services provide connectivity to neighboring employment centers.

At a Glance
Pros & Cons
Advantages
Drawbacks
Head to Head
Compare Rio Rancho
Community Q&A
Questions about Rio Rancho
What people ask about living in and moving to Rio Rancho, New Mexico.
FAQ
Frequently Asked Questions
Businesses for Sale in Rio Rancho
Explore active acquisition & franchise opportunities .
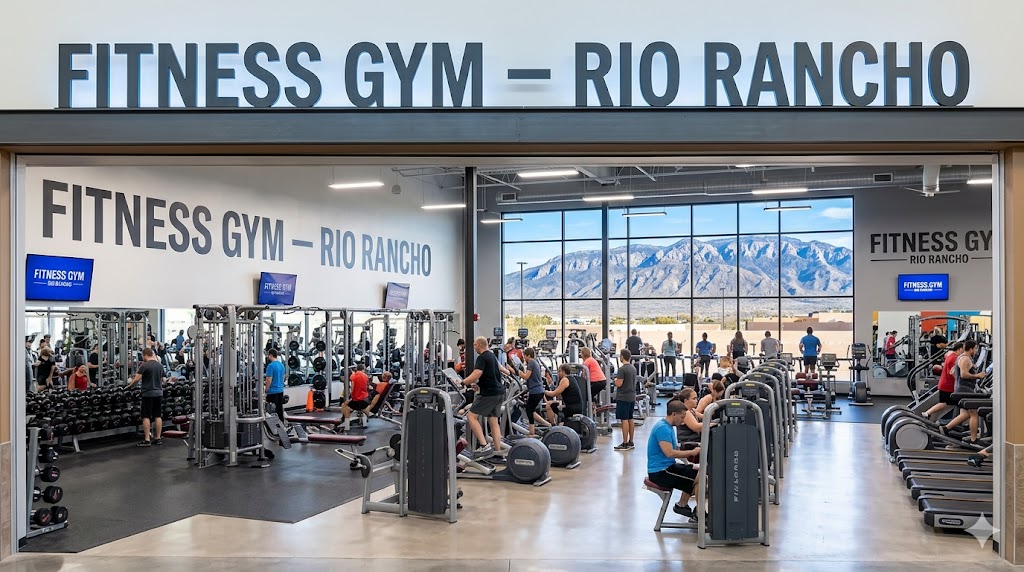
Senior Care in Rio Rancho
18 assisted living, nursing & memory care facilities in Rio Rancho.
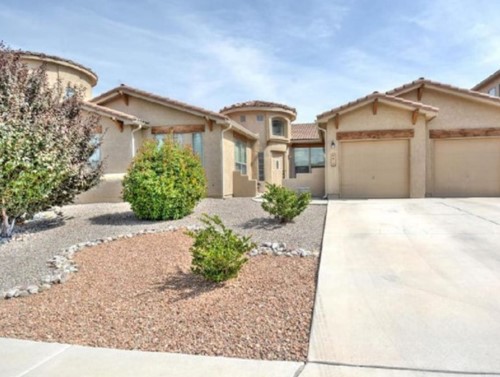 Assisted Living
Loma Pinon Home
Rio Rancho, NM
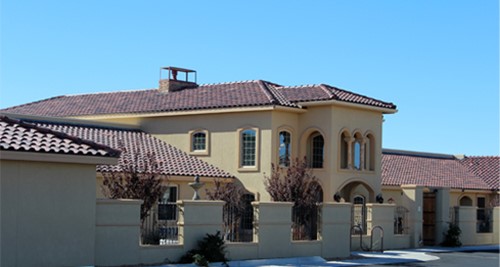 Assisted Living
Life Spire Assisted Living - Rio Rancho
Rio Rancho, NM
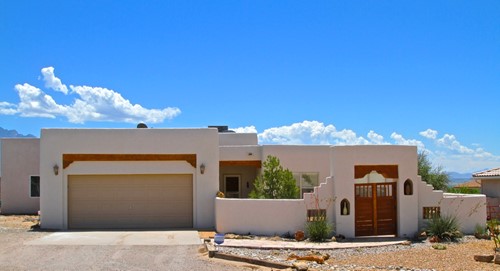 Assisted Living
Monterrey Home
Rio Rancho, NM
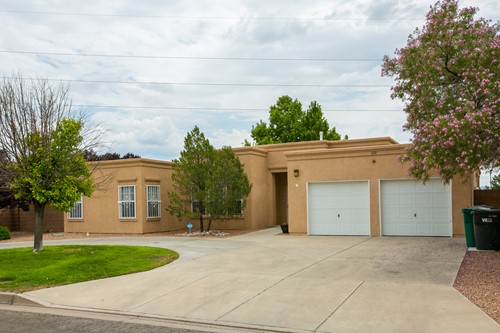 Assisted Living
Haven Care - Dogwood House
Rio Rancho, NM
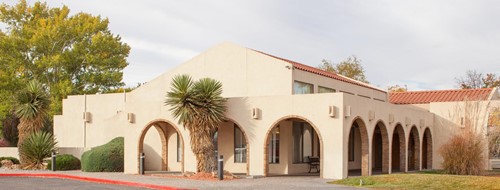 Assisted Living
Rio Rancho Center
Rio Rancho, NM
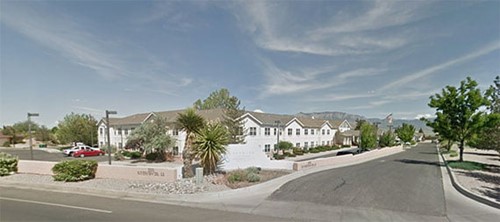 Senior Care
Avamere at Rio Rancho
Rio Rancho, NM
Assisted Living
Loma Pinon Home
Rio Rancho, NM
Assisted Living
Life Spire Assisted Living - Rio Rancho
Rio Rancho, NM
Assisted Living
Monterrey Home
Rio Rancho, NM
Assisted Living
Haven Care - Dogwood House
Rio Rancho, NM
Assisted Living
Rio Rancho Center
Rio Rancho, NM
Senior Care
Avamere at Rio Rancho
Rio Rancho, NM
Free Quotes
Get quotes from local pros in Rio Rancho
Tell us what you need and we’ll pass it to companies that serve your area. It’s free, and there’s no obligation.

Compare Rio Rancho with any city
See how it stacks up on cost, income, and quality of life.
Start Comparing