



City Profile
Hempstead, New York
USA · Comprehensive city data and intelligence
Hempstead, located in Nassau County on Long Island, New York, is the largest town in New York state by population. Established in the 10th century and later settled by the English in 1643, the region blends rich colonial history with modern suburban vitality. People are drawn to Hempstead for its close-knit communities, historic landmarks, and its strategic proximity to New York City.
New York, USA, is a diverse state offering both the fast-paced, culturally rich environment of New York City and the more tranquil, naturally beautiful landscapes of upstate regions. The state's economy, the third largest in the U.S., is heavily driven by service-providing sectors, with finance, healthcare, and professional and business services being major industries, particularly in NYC. Living costs are significantly higher than the national average, especially in New York City where housing is a primary expense, though more affordable options exist upstate. The climate ranges from humid continental in upstate areas with cold, snowy winters and warm summers, to a humid subtropical climate in the New York City metropolitan area, characterized by hot, humid summers and moderately cold winters. The lifestyle varies from the constant energy and extensive cultural, dining, and career opportunities of NYC to a slower pace with abundant outdoor recreation in other parts of the state.
How this 52/100 was calculated five components, with every reading behind them
| Component | Readings used | Points | Weight | Contributes |
|---|---|---|---|---|
| Safety | Safety score: 68 / 100 | 68.0 | 30% | 20.4 |
| Affordability | Cost of living index (100 = national baseline): 135.0 | 0.0 | 25% | 0.0 |
| Economy & jobs | Median household income: $125,000 Income needed to live here: $72,000 Unemployment rate: 3.6% | 90.0 | 20% | 18.0 |
| Growth | Population growth rate: 0.4% Job growth rate: 1.8% | 45.5 | 15% | 6.8 |
| Business climate assessment | Business climate assessment: 68 / 100 | 68.0 | 10% | 6.8 |
| Overall score | 52.0 | |||
Provenance.
These figures were produced by the research pass recorded as
Tier 1 (fast) (q=52, partial — below threshold), last refreshed
16 October 2026.
They are researched estimates drawn from public sources, not a licensed data feed.
Each component is scored against fixed published endpoints, so this number is comparable with any other city and does not move as the dataset grows. Scoring framework 2026.10 — full methodology, weights and accepted ranges.

Featured Events
Happening in Hempstead
Featured and sponsored events in Hempstead.
Local Directory
Businesses in Hempstead
Featured local businesses in Hempstead.

Performance
Quality Scores
Expenses
Cost of Living
The cost of living in Hempstead is notably higher than the national average, driven primarily by housing demand, property taxes, and regional economic pressures associated with the New York metropolitan area. Everyday expenses such as groceries, utilities, and transportation also run above national norms, reflecting the broader economic landscape of Long Island.
Income
Salary Insights
Hempstead benefits from a diverse economy supported by healthcare, education, retail, and professional services. Major employers like local school districts, healthcare networks, and county government provide a stable base of employment. Additionally, its proximity to New York City allows many residents to participate in a robust commuter job market.
The average salary in Hempstead is $78,000 per year. You would need approximately $72,000 to live comfortably.
Employment
Top Industries
Weather
Climate
Mobility
Transport
Transportation in Hempstead is facilitated by the Long Island Rail Road (LIRR), major parkways, and an extensive bus network operated by NICE. While car ownership remains common for navigating the suburbs, commuter rail lines provide efficient access into Manhattan. Walkability varies widely depending on whether you reside in a dense village center or a quieter residential tract.

At a Glance
Pros & Cons
Advantages
Drawbacks
Head to Head
Compare Hempstead
Community Q&A
Questions about Hempstead
What people ask about living in and moving to Hempstead, New York.
FAQ
Frequently Asked Questions
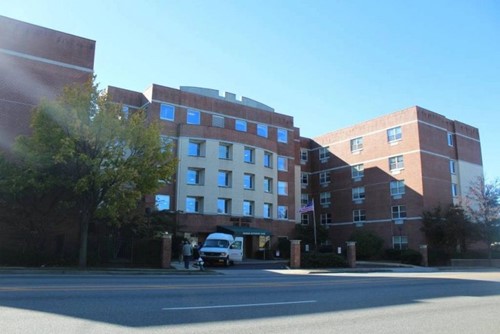
Senior Care in Hempstead
5 assisted living, nursing & memory care facilities in Hempstead.
 Assisted Living
Nassau Rehabilitation & Nursing Center
Hempstead, NY
Hempstead Park Nursing Home
Hempstead, NY
Mayfair Care Center
Hempstead, NY
Able Health Care Services Inc Chha
Hempstead, NY
Family Care Certified Services (Hempstead)
Hempstead, NY
City Guide
Explore Hempstead
Free Quotes
Get quotes from local pros in Hempstead
Tell us what you need and we’ll pass it to companies that serve your area. It’s free, and there’s no obligation.

Compare Hempstead with any city
See how it stacks up on cost, income, and quality of life.
Start Comparing