



City Profile
Schenectady, New York
USA · Comprehensive city data and intelligence
Schenectady, a city with a rich industrial heritage, was once known as "the City that Lights and Hauls the World" due to its historical ties with General Electric and the American Locomotive Company (ALCO) [25, 41]. Situated along the Mohawk River, the city's development was significantly shaped by the Erie Canal, transforming it into a vital transportation and manufacturing hub in the 19th century [25]. Today, Schenectady is undergoing a revitalization, with a focus on redeveloping its downtown area, attracting new businesses, and enhancing cultural attractions like the expanded Proctors Theatre [41]. This ongoing renewal aims to build on the city's history of resilience and foster a dynamic environment for its residents.
New York, USA, is a diverse state offering both the fast-paced, culturally rich environment of New York City and the more tranquil, naturally beautiful landscapes of upstate regions. The state's economy, the third largest in the U.S., is heavily driven by service-providing sectors, with finance, healthcare, and professional and business services being major industries, particularly in NYC. Living costs are significantly higher than the national average, especially in New York City where housing is a primary expense, though more affordable options exist upstate. The climate ranges from humid continental in upstate areas with cold, snowy winters and warm summers, to a humid subtropical climate in the New York City metropolitan area, characterized by hot, humid summers and moderately cold winters. The lifestyle varies from the constant energy and extensive cultural, dining, and career opportunities of NYC to a slower pace with abundant outdoor recreation in other parts of the state.
How this 34/100 was calculated five components, with every reading behind them
| Component | Readings used | Points | Weight | Contributes |
|---|---|---|---|---|
| Safety | Safety score: 9 / 100 | 9.0 | 30% | 2.7 |
| Affordability | Cost of living index (100 = national baseline): 99.0 | 45.0 | 25% | 11.3 |
| Economy & jobs | Median household income: $58,399 Income needed to live here: $70,000 Unemployment rate: 5% | 33.4 | 20% | 6.7 |
| Growth | Population growth rate: 1% Job growth rate: 0.92% | 44.2 | 15% | 6.6 |
| Business climate assessment | Business climate assessment: 65 / 100 | 65.0 | 10% | 6.5 |
| Overall score | 33.8 | |||
Provenance.
These figures were produced by the research pass recorded as
Tier 2 (reasoned) (q=60, partial — below threshold), last refreshed
27 August 2026.
They are researched estimates drawn from public sources, not a licensed data feed.
Each component is scored against fixed published endpoints, so this number is comparable with any other city and does not move as the dataset grows. Scoring framework 2026.10 — full methodology, weights and accepted ranges.

Featured Events
Happening in Schenectady
Featured and sponsored events in Schenectady.
Local Directory
Businesses in Schenectady
Featured local businesses in Schenectady.

Performance
Quality Scores
Expenses
Cost of Living
Schenectady offers a cost of living that is generally more affordable than the national average, particularly when compared to New York State's higher-priced urban centers. While some sources indicate it is about 1% less expensive than the US average [22], others suggest it might be slightly higher overall, with housing costs being a significant factor in its affordability relative to New York City [4, 21]. The city's cost of living index is 99, meaning it is just 1% less expensive than the national average [22]. This relative affordability, especially in housing, makes Schenectady an attractive option for those seeking a balance between cost and access to amenities.
Income
Salary Insights
Schenectady's economy is diverse, with key sectors including Health Care & Social Assistance, Retail Trade, and Educational Services forming the backbone of its employment landscape [3, 9, 10, 31]. The city also benefits from a presence in Manufacturing and Professional, Scientific, and Technical Services, with General Electric (GE) remaining a significant employer and contributor to the region's technological advancements [25, 39, 41]. The job market has seen steady growth, with Schenectady County experiencing an employment growth rate of 0.917% from 2023 to 2024 [10]. The city's revitalization efforts have also spurred growth in tech firms and renewable energy sectors, contributing to a dynamic job market [25, 41].
The average salary in Schenectady is $55,374 per year. You would need approximately $70,000 to live comfortably.
Employment
Top Industries
Weather
Climate
Mobility
Transport
Getting around Schenectady involves a mix of personal vehicles and public transit, with a moderate walkability score of 60/100 [4, 6, 27]. The average commute time is 22 minutes [3, 26], and while 77% of residents travel by personal vehicle, there is also access to public transit options, reflected in a transit score of 50/100 [26, 27]. Car ownership is noted as being lower than the national average, with an average of one car per household [3], suggesting a medium level of car dependency.

At a Glance
Pros & Cons
Advantages
Drawbacks
Head to Head
Compare Schenectady
Community Q&A
Questions about Schenectady
What people ask about living in and moving to Schenectady, New York.
How do the public schools in Schenectady rank academically?
Schenectady’s public schools are overseen by a citywide district that publishes performance metrics, including state test scores and graduation rates, on its website. While the district offers a range of programs—from traditional curricula to specialized magnet tracks—overall academic performance tends to be around the state average. Prospective families should review the district’s annual report cards, visit school...
What is the typical rent for a one‑bedroom apartment in Schenectady?
The average rent in Schenectady is $1,425 per month. One‑bedroom units in central areas tend to hover around this figure, though exact prices can vary based on building age, amenities, and exact location. To find current listings, check regional rental websites, local classifieds, or the city’s housing authority portal, which often provides up‑to‑date vacancy information and rent‑control guidelines if applicable. Rem...
How does the cost of living in Schenectady compare to the national average?
Schenectady’s cost‑of‑living index is 99, which is essentially on par with the national average of 100. This means that everyday expenses such as groceries, utilities, and transportation are roughly comparable to what you would pay anywhere in the United States. Because the index is so close to the benchmark, you can expect your current spending habits to translate fairly directly, with only minor variations dependin...
Is Schenectady a safe place to live?
Schenectady’s safety score is 9.0 out of 100, indicating a higher level of crime relative to many other U.S. cities. While certain neighborhoods may experience more incidents, the city has active community policing initiatives and neighborhood watch programs aimed at improving safety. Prospective residents should review recent crime statistics on the city’s public safety portal, talk to local residents, and consider...
Where can I find hospitals or urgent care in Schenectady?
The city hosts a major medical center that offers emergency, inpatient, and specialty services, as well as several urgent‑care clinics scattered across the area. These facilities are affiliated with regional health networks and accept a wide range of insurance plans. To locate the nearest provider, use the health system’s online provider directory or the state health department’s facility locator tool. It’s also advi...
What should I know about utilities and services when moving to Schenectady?
When you relocate to Schenectady, you’ll need to arrange for electricity, natural gas, water, and waste services through the city’s utility providers. Contact the electric and gas companies ahead of time to schedule activation dates, and verify any deposits required. Water and sewer services are typically managed by the municipal public works department, which can be reached via the city’s official website. For inter...
How does the overall quality of life in Schenectady compare to nearby cities?
Schenectady offers a lower average rent ($1,425) than many neighboring cities, while its median salary of $55,374 aligns closely with regional averages. The cost‑of‑living index of 99 means daily expenses are on par with the national average, providing a balanced budget environment. While the safety score of 9.0 suggests higher crime levels, the city compensates with active community programs and a range of affordabl...
What are the average salaries like in Schenectady?
The median annual salary in Schenectady is $55,374. This figure reflects a broad range of occupations, including professional, technical, and service roles. Engineering positions often pay above the median, especially in sectors tied to local manufacturing, technology, or research institutions. To gauge specific salary expectations, review job postings on regional employment boards or use salary comparison tools that...
What recreational activities are popular in Schenectady?
Schenectady offers a variety of cultural and outdoor options. The city maintains several parks with trails, playgrounds, and sports fields, ideal for family outings. There are also museums, historic sites, and community theaters that host regular events and exhibitions. Seasonal festivals and farmers’ markets provide opportunities to experience local food and crafts. For a full calendar of activities, check the city’...
What public transportation options are available in Schenectady?
Schenectady is served by a municipal transit authority that operates bus routes throughout the city and connects to neighboring communities. The system includes regular weekday service, limited weekend schedules, and options for paratransit. For commuters, there are also regional rail lines that stop in the city, providing access to larger metropolitan areas. You can view route maps, timetables, and fare information...
Some answers here were drafted as a starting point and may be out of date. Live in Schenectady? Add your own.
FAQ
Frequently Asked Questions
Senior Care in Schenectady
7 assisted living, nursing & memory care facilities in Schenectady.
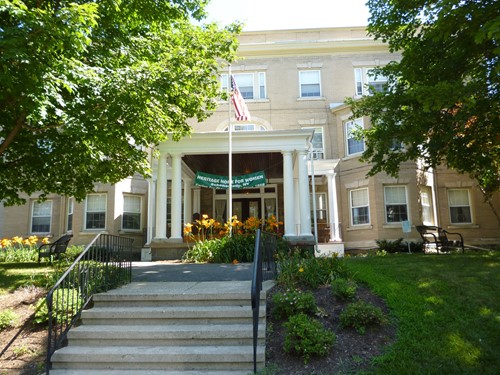 Assisted Living
Heritage Home for Women
Schenectady, NY
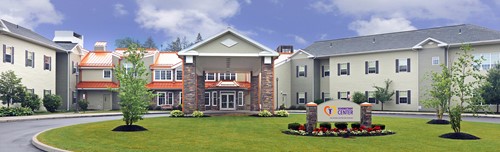 Assisted Living
Schenectady Center For Rehabilitation And Nursing
Schenectady, NY
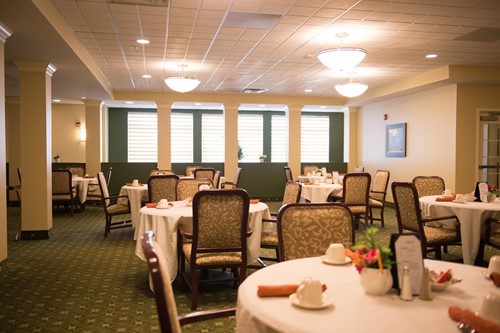 Assisted Living
Kingsway Manor, LLC
Schenectady, NY
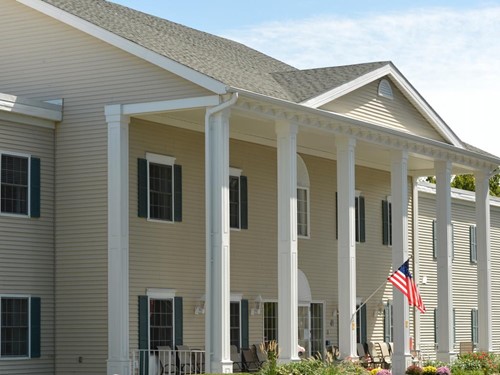 Assisted Living
Kingsway Arms Assisted Living
Schenectady, NY
 Assisted Living
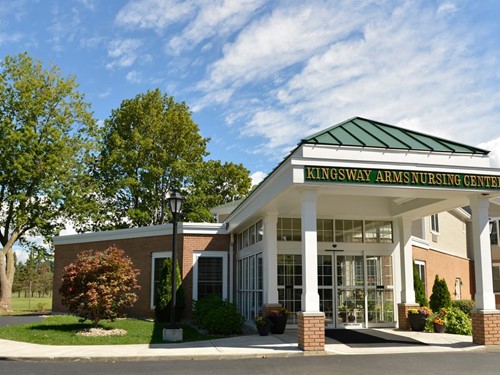
Kingsway Arms Nursing Center
Schenectady, NY
 Assisted Living
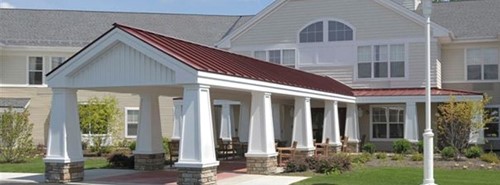
Ingersoll Place
Schenectady, NY
Ellis Residential & Rehabilitation Center
Schenectady, NY
City Guide
Explore Schenectady
Free Quotes
Get quotes from local pros in Schenectady
Tell us what you need and we’ll pass it to companies that serve your area. It’s free, and there’s no obligation.

Compare Schenectady with any city
See how it stacks up on cost, income, and quality of life.
Start Comparing