



City Profile
Yonkers, New York
USA · Comprehensive city data and intelligence
Yonkers, located in Westchester County just north of New York City, is the third-most populous city in New York State. Known as the 'City of Seven Hills,' it offers a rich blend of urban convenience and historic Hudson River valley charm. Residents are continually drawn to Yonkers for its strategic location, vibrant waterfront redevelopment areas, and noticeably more accessible housing options compared to neighboring Manhattan.
Originally established as a Dutch patroonship, Yonkers evolved into a major manufacturing powerhouse in the 19th and 20th centuries, notable for inventions like the elevator by Elisha Otis. Today, the city has transitioned into a diverse residential and commercial hub. Neighborhoods like Downtown Yonkers and the Crosstown feature a mix of historic architecture, modern luxury high-rises, and bustling local commerce.
People move to Yonkers seeking a seamless commute to New York City paired with a distinct community identity. The city offers expansive park systems, sweeping views of the Palisades, and a thriving arts and culinary scene. As ongoing urban revitalization efforts continue to attract investment, Yonkers remains a cornerstone of the Hudson Valley region.
New York, USA, is a diverse state offering both the fast-paced, culturally rich environment of New York City and the more tranquil, naturally beautiful landscapes of upstate regions. The state's economy, the third largest in the U.S., is heavily driven by service-providing sectors, with finance, healthcare, and professional and business services being major industries, particularly in NYC. Living costs are significantly higher than the national average, especially in New York City where housing is a primary expense, though more affordable options exist upstate. The climate ranges from humid continental in upstate areas with cold, snowy winters and warm summers, to a humid subtropical climate in the New York City metropolitan area, characterized by hot, humid summers and moderately cold winters. The lifestyle varies from the constant energy and extensive cultural, dining, and career opportunities of NYC to a slower pace with abundant outdoor recreation in other parts of the state.
How this 49/100 was calculated five components, with every reading behind them
| Component | Readings used | Points | Weight | Contributes |
|---|---|---|---|---|
| Safety | Safety score: 68 / 100 | 68.0 | 30% | 20.4 |
| Affordability | Cost of living index (100 = national baseline): 128.0 | 8.8 | 25% | 2.2 |
| Economy & jobs | Median household income: $82,500 Income needed to live here: $68,000 Unemployment rate: 4.3% | 61.5 | 20% | 12.3 |
| Growth | Population growth rate: 0.4% Job growth rate: 1.8% | 45.5 | 15% | 6.8 |
| Business climate assessment | Business climate assessment: 70 / 100 | 70.0 | 10% | 7.0 |
| Overall score | 48.7 | |||
Provenance.
These figures were produced by the research pass recorded as
Tier 1 (fast) (q=54, partial — below threshold), last refreshed
16 October 2026.
They are researched estimates drawn from public sources, not a licensed data feed.
Each component is scored against fixed published endpoints, so this number is comparable with any other city and does not move as the dataset grows. Scoring framework 2026.10 — full methodology, weights and accepted ranges.

Featured Events
Happening in Yonkers
Featured and sponsored events in Yonkers.
Local Directory
Businesses in Yonkers
Featured local businesses in Yonkers.

Performance
Quality Scores
Expenses
Cost of Living
The cost of living in Yonkers is higher than the national U.S. average, largely driven by its proximity to New York City and regional housing demands. While it is generally more affordable than living directly in Manhattan or Brooklyn, residents still face elevated expenses for real estate, property taxes, and local services. Housing constitutes the single largest expenditure for households across the city.
Aside from housing, everyday expenses such as groceries, utilities, and transportation align closely with regional New York metropolitan trends. State and local tax structures also contribute to the overall cost burden, though many residents find the trade-off worthwhile given the proximity to high-paying job markets and cultural amenities. Energy and utility costs fluctuate seasonally, reflecting the area's distinct winter heating and summer cooling demands.
Income
Salary Insights
Yonkers features a diversified economy anchored by healthcare, education, retail trade, and professional services. Major local employers include St. John's Riverside Hospital, St. Joseph's Medical Center, and the Yonkers Public Schools system, providing robust employment opportunities in the medical and public sectors. Additionally, the city's burgeoning film production industry—bolstered by major studio facilities like Lionsgate Studios Yonkers—has added a dynamic creative sector to the local labor market.
The city's economy benefits from its strategic transportation corridors, making it attractive for logistics, distribution, and corporate operations. While a significant portion of the resident workforce commutes southward into New York City for higher-paying corporate roles, local economic development initiatives are actively expanding homegrown entrepreneurship and small business growth.
The average salary in Yonkers is $74,000 per year. You would need approximately $68,000 to live comfortably.
Employment
Top Industries
Weather
Climate
Mobility
Transport
Yonkers boasts exceptional regional transit connectivity, anchored by multiple Metro-North Railroad stations providing rapid commuter access to Grand Central Terminal. The Bee-Line bus system offers comprehensive local coverage, while major highways like the Sprain Brook Parkway, Saw Mill River Parkway, and New York State Thruway facilitate travel by car. Walkability varies significantly, with highly walkable districts concentrated around downtown transit hubs.

At a Glance
Pros & Cons
Advantages
Drawbacks
Head to Head
Compare Yonkers
Community Q&A
Questions about Yonkers
What people ask about living in and moving to Yonkers, New York.
FAQ
Frequently Asked Questions
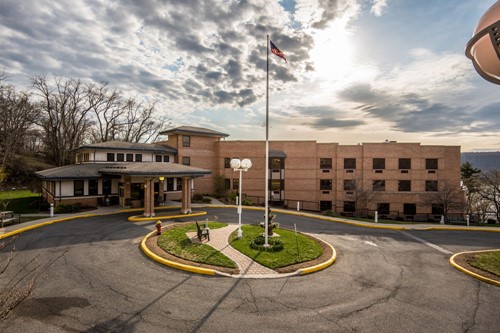
Senior Care in Yonkers
10 assisted living, nursing & memory care facilities in Yonkers.
 Assisted Living
Adira At Riverside Rehabilitation And Nursing
Yonkers, NY
Sunrise at Crestwood
Yonkers, NY
Elizabeth Seton Pediatric Center
Yonkers, NY
Westchester Center for Independent & Assisted
Yonkers, NY
Sans Souci Rehabilitation And Nursing Center
Yonkers, NY
Palisade Gardens
Yonkers, NY
Regency Extended Care Center
Yonkers, NY
Yonkers Gardens Center For Nursing And Rehab
Yonkers, NY
St. Michael's Home
Yonkers, NY
Five Star Premier Residences of Yonkers
Yonkers, NY
City Guide
Explore Yonkers
Free Quotes
Get quotes from local pros in Yonkers
Tell us what you need and we’ll pass it to companies that serve your area. It’s free, and there’s no obligation.

Compare Yonkers with any city
See how it stacks up on cost, income, and quality of life.
Start Comparing