



City Profile
Glendale, Arizona
USA · Comprehensive city data and intelligence
Glendale, Arizona, situated in Maricopa County just northwest of Phoenix, has evolved from a historic agricultural community founded in the late 19th century into a bustling major suburb. Known widely for its vibrant sports and entertainment district, the city uniquely combines a charming historic downtown featuring antique shops with ultra-modern mega-developments. People are continually drawn to Glendale for its sunny climate, relatively affordable housing compared to coastal markets, and rich calendar of major national events.
Arizona offers a diverse landscape, from low-elevation deserts to mountainous regions, and is known for its abundant sunshine, averaging around 300 sunny days per year. The state's economy is moderately diverse, with major industries including manufacturing (especially aerospace, defense, transportation, and electronics), healthcare, real estate, tourism, technology, bioscience, agriculture (cotton, citrus), and mining (copper). While the cost of living in Arizona is generally higher than the national average, particularly for housing, the state's mild winters and opportunities for outdoor activities contribute to an appealing lifestyle for many.
How this 60/100 was calculated five components, with every reading behind them
| Component | Readings used | Points | Weight | Contributes |
|---|---|---|---|---|
| Safety | Safety score: 68 / 100 | 68.0 | 30% | 20.4 |
| Affordability | Cost of living index (100 = national baseline): 98.0 | 46.3 | 25% | 11.6 |
| Economy & jobs | Median household income: $73,530 Income needed to live here: $55,000 Unemployment rate: 4.9% | 65.4 | 20% | 13.1 |
| Growth | Population growth rate: 1.2% Job growth rate: 1.8% | 55.5 | 15% | 8.3 |
| Business climate assessment | Business climate assessment: 70 / 100 | 70.0 | 10% | 7.0 |
| Overall score | 60.4 | |||
Provenance.
These figures were produced by the research pass recorded as
Gemini (Tier 1 (fast), q=73), last refreshed
11 October 2026.
They are researched estimates drawn from public sources, not a licensed data feed.
Each component is scored against fixed published endpoints, so this number is comparable with any other city and does not move as the dataset grows. Scoring framework 2026.10 — full methodology, weights and accepted ranges.

Featured Events
Happening in Glendale
Featured and sponsored events in Glendale.
Local Directory
Businesses in Glendale
Featured local businesses in Glendale.

Performance
Quality Scores
Expenses
Cost of Living
The cost of living in Glendale hovers near the national average, making it an attractive option for families and young professionals seeking value in the Phoenix metropolitan area. While housing costs have risen notably over recent years due to regional demand, everyday expenses such as groceries and transportation remain manageable. Utility costs can spike significantly during the intense summer months due to heavy air conditioning usage, which is an important factor for household budgeting.
Income
Salary Insights
Glendale features a diversified economy anchored by healthcare, education, retail trade, and the burgeoning sports and tourism sectors. Major employment hubs include the Westgate Entertainment District, Midwestern University, and the sprawling Luke Air Force Base located nearby. The local job market benefits from steady employment growth across the Phoenix-Mesa-Chandler metropolitan area, alongside a supportive environment for remote workers and small business startups.
The average salary in Glendale is $62,000 per year. You would need approximately $55,000 to live comfortably.
Employment
Top Industries
Weather
Climate
Mobility
Transport
Glendale is a predominantly car-dependent city, where most residents commute via personal vehicles along major arterial grids and freeways like the Loop 101. Public transit options include regional bus services provided by Valley Metro, though coverage is optimized primarily for major corridors rather than door-to-door convenience. Average commute times align closely with regional benchmarks at roughly 27 to 28 minutes.

At a Glance
Pros & Cons
Advantages
Drawbacks
Head to Head
Compare Glendale
Community Q&A
Questions about Glendale
What people ask about living in and moving to Glendale, Arizona.
FAQ
Frequently Asked Questions
Senior Care in Glendale
179 assisted living, nursing & memory care facilities in Glendale.
 Senior Care
LifeStream Complete Senior Living at Thunderbird
Glendale, AZ
 Senior Care
VEMA Corporation
Glendale, AZ
 Senior Care
Age Care Limited, LLC
Glendale, AZ
 Senior Care
Thunderbird Home - Hospice of the Valley
Glendale, AZ
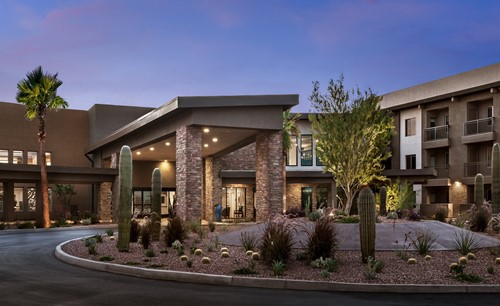 Senior Care
Inspira at Arrowhead
Glendale, AZ
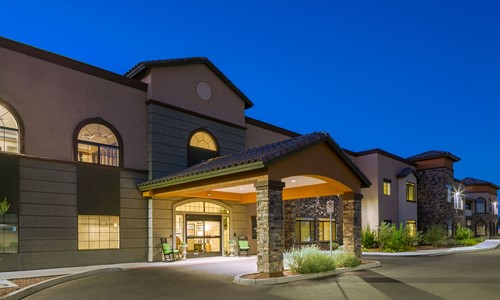 Assisted Living
Orchard Pointe at Arrowhead
Glendale, AZ
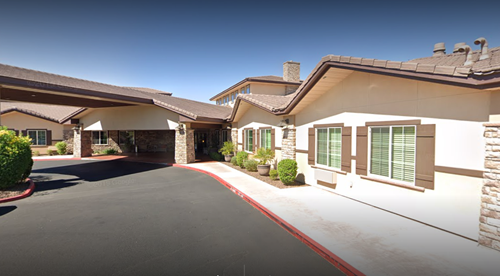 Assisted Living
Advanced Health Care Of Glendale
Glendale, AZ
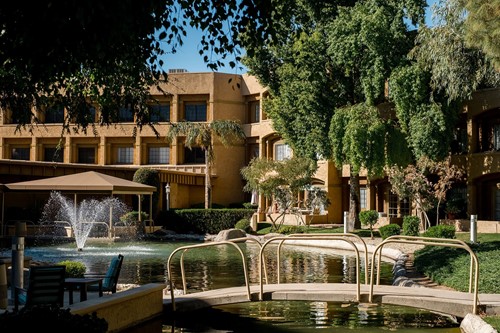 Senior Care
Thunderbird Senior Living Community
Glendale, AZ
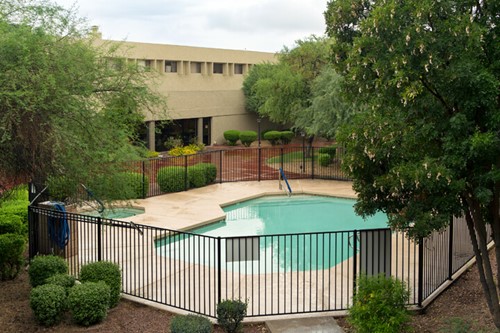 Senior Care
LifeStream at Glendale
Glendale, AZ
 Assisted Living
Providence Place At Glencroft
Glendale, AZ
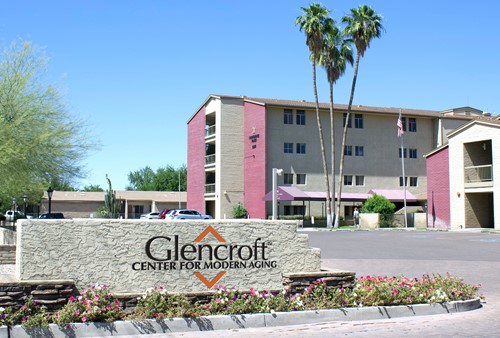 Senior Care
Glencroft Senior Living
Glendale, AZ
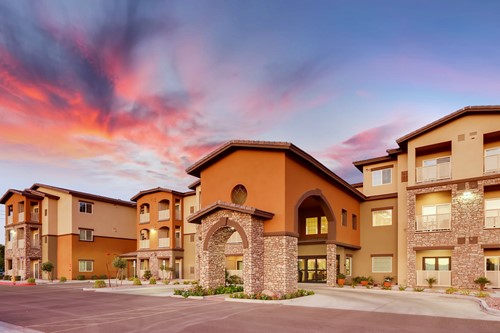 Senior Care
Westgate Village
Glendale, AZ
Free Quotes
Get quotes from local pros in Glendale
Tell us what you need and we’ll pass it to companies that serve your area. It’s free, and there’s no obligation.

Compare Glendale with any city
See how it stacks up on cost, income, and quality of life.
Start Comparing