



City Profile
Surprise, Arizona
USA · Comprehensive city data and intelligence
Surprise is a rapidly expanding suburban city located in Maricopa County, Arizona, roughly 45 minutes northwest of downtown Phoenix. Founded in 1938 by Flora Mae Statler as a small agricultural settlement, the city has evolved into a vibrant and dynamic community in the West Valley. Today, Surprise offers residents a distinct small-town feel paired with modern master-planned neighborhoods, attracting a balanced mix of young families, working professionals, and active retirees.
Arizona offers a diverse landscape, from low-elevation deserts to mountainous regions, and is known for its abundant sunshine, averaging around 300 sunny days per year. The state's economy is moderately diverse, with major industries including manufacturing (especially aerospace, defense, transportation, and electronics), healthcare, real estate, tourism, technology, bioscience, agriculture (cotton, citrus), and mining (copper). While the cost of living in Arizona is generally higher than the national average, particularly for housing, the state's mild winters and opportunities for outdoor activities contribute to an appealing lifestyle for many.
How this 75/100 was calculated five components, with every reading behind them
| Component | Readings used | Points | Weight | Contributes |
|---|---|---|---|---|
| Safety | Safety score: 85 / 100 | 85.0 | 30% | 25.5 |
| Affordability | Cost of living index (100 = national baseline): 98.0 | 46.3 | 25% | 11.6 |
| Economy & jobs | Median household income: $96,711 Income needed to live here: $60,000 Unemployment rate: 4.2% | 86.3 | 20% | 17.3 |
| Growth | Population growth rate: 3.31% Job growth rate: 2.8% | 88.0 | 15% | 13.2 |
| Business climate assessment | Business climate assessment: 72 / 100 | 72.0 | 10% | 7.2 |
| Overall score | 74.7 | |||
Provenance.
These figures were produced by the research pass recorded as
Gemini (ungrounded) (q=55, partial — below threshold), last refreshed
11 October 2026.
They are researched estimates drawn from public sources, not a licensed data feed.
Each component is scored against fixed published endpoints, so this number is comparable with any other city and does not move as the dataset grows. Scoring framework 2026.10 — full methodology, weights and accepted ranges.

Featured Events
Happening in Surprise
Featured and sponsored events in Surprise.
Local Directory
Businesses in Surprise
Featured local businesses in Surprise.

Performance
Quality Scores
Expenses
Cost of Living
The cost of living in Surprise sits slightly below or near the national average, making it an attractive and relatively affordable alternative to core metropolitan centers like Phoenix or Scottsdale. While housing and property values have appreciated significantly due to rapid population influx, everyday goods, utilities, and transportation expenses remain competitive. Residents benefit from Arizona's balanced tax structure, though summer cooling costs can temporarily inflate utility bills.
Income
Salary Insights
Surprise features a growing and diversified local economy anchored heavily by healthcare, retail trade, education, and manufacturing sectors. Major local employers include the Dysart Unified School District, local municipal operations, and expanding commercial hubs like the Prasada shopping district. Additionally, initiatives like the Spark Surprise business incubator foster an entrepreneurial spirit, while proximity to the broader Phoenix job market supports extensive commuting and remote work opportunities.
The average salary in Surprise is $72,000 per year. You would need approximately $60,000 to live comfortably.
Employment
Top Industries
Weather
Climate
Mobility
Transport
Surprise is heavily car-dependent, with major thoroughfares like U.S. Route 60 and Loop 303 facilitating regional transit across the Phoenix metropolitan area. Public transit options within the city limits are limited, meaning most residents rely on personal vehicles for daily commuting and errands. Average commute times generally align with regional suburban standards.

At a Glance
Pros & Cons
Advantages
Drawbacks
Head to Head
Compare Surprise
Community Q&A
Questions about Surprise
What people ask about living in and moving to Surprise, Arizona.
FAQ
Frequently Asked Questions
Related
Insights about Surprise
Senior Care in Surprise
146 assisted living, nursing & memory care facilities in Surprise.
 Senior Care
Benevilla
Surprise, AZ
 Senior Care
Chaparral Winds Independent Living
Surprise, AZ
 Senior Care
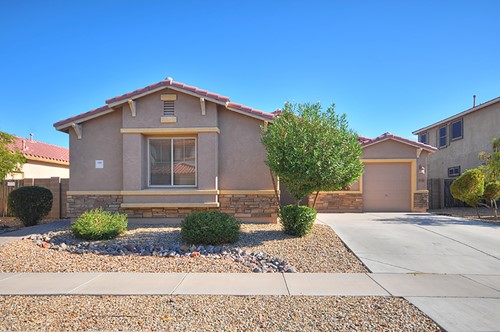
Brookhaven Assisted Living
Surprise, AZ
 Assisted Living
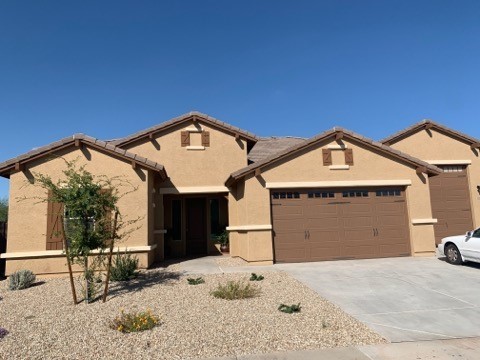
About Seniors Assisted Living
Surprise, AZ
 Assisted Living
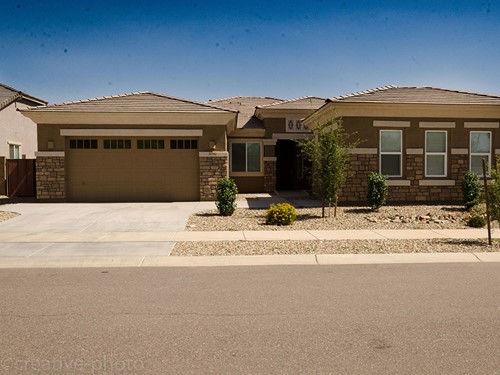
Love And Care III Assisted Living
Surprise, AZ
 Assisted Living
Love And Care II Assisted Living
Surprise, AZ
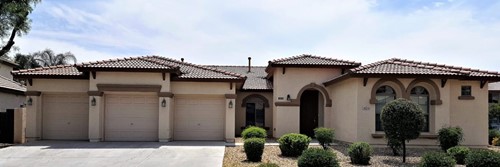 Assisted Living
Ivy Lane Assisted Living
Surprise, AZ
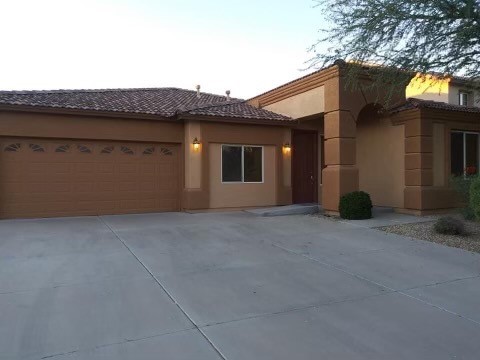 Assisted Living
Love And Care Assisted Living
Surprise, AZ
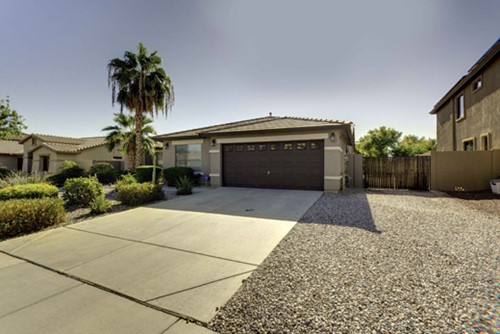 Assisted Living
Best Care Assisted Living
Surprise, AZ
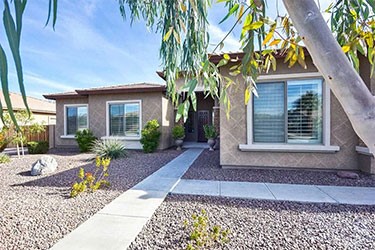 Assisted Living
A Paradise for Parents Assisted Living & Memory Care
Surprise, AZ
 Assisted Living
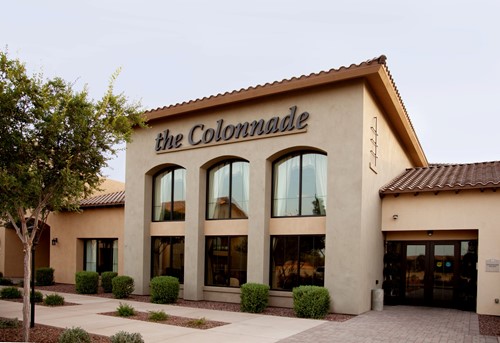
The Colonnade Assisted Living & Memory Care
Surprise, AZ
 Assisted Living
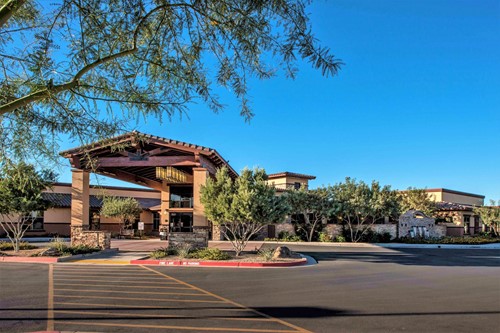
Sante Of Surprise
Surprise, AZ
City Guide
Explore Surprise
Free Quotes
Get quotes from local pros in Surprise
Tell us what you need and we’ll pass it to companies that serve your area. It’s free, and there’s no obligation.

Compare Surprise with any city
See how it stacks up on cost, income, and quality of life.
Start Comparing