



City Profile
Phoenix, Arizona
USA · Comprehensive city data and intelligence
Phoenix, often called the "Valley of the Sun," is the capital and most populous city in Arizona, known for its year-round warm temperatures and abundant sunshine. The city has a rich history rooted in agriculture and mining, evolving into a major metropolitan hub in the Southwestern United States. Its desert landscape, framed by mountains, offers a unique blend of urban amenities and outdoor recreational opportunities. Phoenix attracts a diverse population, including retirees, young professionals, and families, drawn by its growing economy, relatively affordable cost of living compared to coastal cities, and a vibrant lifestyle.
Arizona offers a diverse landscape, from low-elevation deserts to mountainous regions, and is known for its abundant sunshine, averaging around 300 sunny days per year. The state's economy is moderately diverse, with major industries including manufacturing (especially aerospace, defense, transportation, and electronics), healthcare, real estate, tourism, technology, bioscience, agriculture (cotton, citrus), and mining (copper). While the cost of living in Arizona is generally higher than the national average, particularly for housing, the state's mild winters and opportunities for outdoor activities contribute to an appealing lifestyle for many.
How this 56/100 was calculated five components, with every reading behind them
| Component | Readings used | Points | Weight | Contributes |
|---|---|---|---|---|
| Safety | Safety score: 56 / 100 | 56.0 | 30% | 16.8 |
| Affordability | Cost of living index (100 = national baseline): 105.0 | 37.5 | 25% | 9.4 |
| Economy & jobs | Median household income: $81,332 Income needed to live here: $52,974 Unemployment rate: 4% | 83.5 | 20% | 16.7 |
| Growth | Population growth rate: 0.75% Job growth rate: 0.7% | 38.9 | 15% | 5.8 |
| Business climate assessment | Business climate assessment: 75 / 100 | 75.0 | 10% | 7.5 |
| Overall score | 56.2 | |||
Provenance.
These figures were produced by the research pass recorded as
Gemini (Tier 3 (deep think), q=89), last refreshed
18 August 2026.
They are researched estimates drawn from public sources, not a licensed data feed.
Each component is scored against fixed published endpoints, so this number is comparable with any other city and does not move as the dataset grows. Scoring framework 2026.10 — full methodology, weights and accepted ranges.

Featured Events
Happening in Phoenix
Featured and sponsored events in Phoenix.
Local Directory
Businesses in Phoenix
Featured local businesses in Phoenix.

Performance
Quality Scores
Expenses
Cost of Living
The cost of living in Phoenix is approximately 5% higher than the national average, primarily driven by housing expenses. While some categories like groceries are slightly above the national average, healthcare costs tend to be lower. Utilities, particularly electricity for air conditioning during the hot summers, can be a significant expense. However, the overall cost remains competitive when compared to major metropolitan areas on the West Coast, making it an attractive option for those relocating from more expensive regions.
Income
Salary Insights
Phoenix boasts a dynamic and growing job market, with a projected job growth rate of 0.7% in 2026 for the Phoenix Metropolitan Statistical Area. The region's economy is diverse, with professional and business services accounting for approximately 16% of total employment, and healthcare and social assistance close behind at 15%. Key growth sectors also include semiconductors, manufacturing, aerospace, and information technology, attracting significant investment and creating new opportunities. Phoenix is recognized as a supportive environment for small businesses and startups, ranking highly in national studies for entrepreneurial climate.
The average salary in Phoenix is $49,356 per year. You would need approximately $52,974 to live comfortably.
Employment
Top Industries
Weather
Climate
Mobility
Transport
Getting around Phoenix primarily relies on personal vehicles, with about 74.6% of residents driving alone. The average one-way commute time is approximately 26 minutes, slightly less than the national average. While the city has a walkability score of 41, indicating a car-dependent environment, specific neighborhoods like Downtown Phoenix are considerably more walkable. Public transit, managed by Valley Metro, is growing, with a transit score of 42 and increasing ridership, but it serves a smaller portion of the population compared to driving.

At a Glance
Pros & Cons
Advantages
Drawbacks
Head to Head
Compare Phoenix
Community Q&A
Questions about Phoenix
What people ask about living in and moving to Phoenix, Arizona.
FAQ
Frequently Asked Questions
Related
Insights about Phoenix
Businesses for Sale in Phoenix
Explore active acquisition & franchise opportunities .
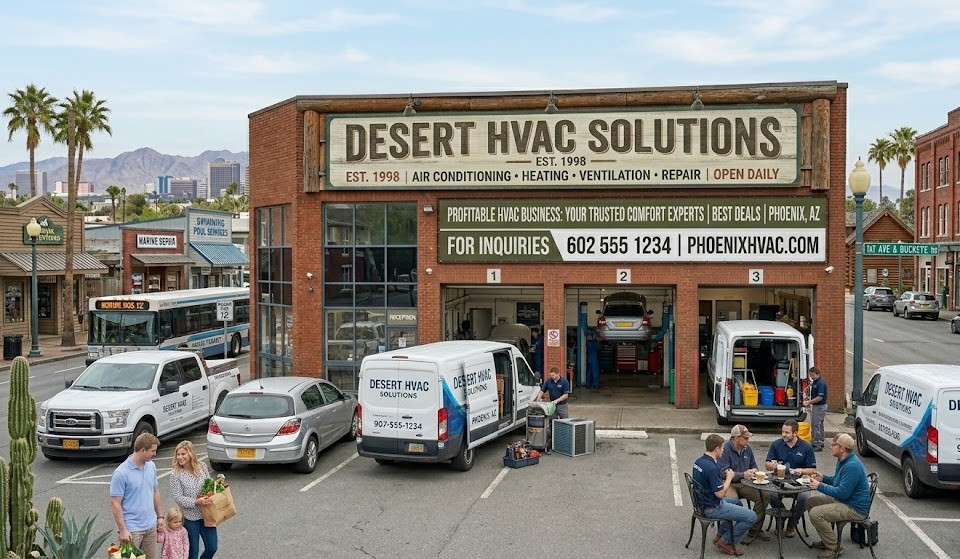 Service Company
Profitable HVAC Business for Sale – Phoenix
Phoenix, Arizona
 Established Business
Profitable HVAC Installation & Repair Company in Phoenix
Phoenix, Arizona
 Home Based Business
Residential & Commercial Cleaning Service in Phoenix
Phoenix, Arizona
 Brick & Mortar
Auto Repair Shop in Phoenix with Loyal Customers
Phoenix, Arizona
Senior Care in Phoenix
564 assisted living, nursing & memory care facilities in Phoenix.
 Senior Care
Bethesda Gardens Phoenix
Phoenix, AZ
 Senior Care
Vista Living Senior Care (Camelback)
Phoenix, AZ
 Senior Care
Desert Sierra Assisted Living
Phoenix, AZ
 Senior Care
Hillside Assisted Living
Phoenix, AZ
 Senior Care
Chateaux Assisted Living
Phoenix, AZ
 Senior Care
Desert Sierra Assisted Living
Phoenix, AZ
 Senior Care
Adagio Gardens Central
Phoenix, AZ
 Senior Care
Adagio Gardens
Phoenix, AZ
 Senior Care
Summit Healthcare Services
phoenix, AZ
 Senior Care
Care Givers Of Arizona, INC.
Phoenix, AZ
 Senior Care
Hillside Assisted Living
Phoenix, AZ
 Senior Care
Desert Cierra Assisted Living
Phoenix, AZ
City Guide
Explore Phoenix
Free Quotes
Get quotes from local pros in Phoenix
Tell us what you need and we’ll pass it to companies that serve your area. It’s free, and there’s no obligation.

Compare Phoenix with any city
See how it stacks up on cost, income, and quality of life.
Start Comparing