



City Profile
Prescott, Arizona
USA · Comprehensive city data and intelligence
Prescott, Arizona, is a historic city nestled in the Bradshaw Mountains of Yavapai County, renowned for its Victorian-era architecture and mile-high elevation. Originally established as the territorial capital of Arizona in 1864, the city exudes a distinct Western character deeply tied to its gold-mining and frontier heritage. Today, Prescott is celebrated for its scenic pine forests, pleasant four-season climate, and vibrant cultural community anchored by the famous Whiskey Row.
People are drawn to Prescott for its harmonious blend of small-town charm, outdoor recreation, and urban convenience. The city attracts a mix of retirees looking for a peaceful mountain retreat and families or remote workers seeking a slower-paced environment without sacrificing modern amenities. With robust community traditions, local art galleries, and a thriving historic downtown, Prescott maintains a unique identity distinct from Arizona's sprawling desert metropolises.
Arizona offers a diverse landscape, from low-elevation deserts to mountainous regions, and is known for its abundant sunshine, averaging around 300 sunny days per year. The state's economy is moderately diverse, with major industries including manufacturing (especially aerospace, defense, transportation, and electronics), healthcare, real estate, tourism, technology, bioscience, agriculture (cotton, citrus), and mining (copper). While the cost of living in Arizona is generally higher than the national average, particularly for housing, the state's mild winters and opportunities for outdoor activities contribute to an appealing lifestyle for many.
How this 61/100 was calculated five components, with every reading behind them
| Component | Readings used | Points | Weight | Contributes |
|---|---|---|---|---|
| Safety | Safety score: 78 / 100 | 78.0 | 30% | 23.4 |
| Affordability | Cost of living index (100 = national baseline): 104.0 | 38.8 | 25% | 9.7 |
| Economy & jobs | Median household income: $70,874 Income needed to live here: $52,000 Unemployment rate: 4.8% | 67.7 | 20% | 13.5 |
| Growth | Population growth rate: 1.1% Job growth rate: 1.5% | 51.3 | 15% | 7.7 |
| Business climate assessment | Business climate assessment: 68 / 100 | 68.0 | 10% | 6.8 |
| Overall score | 61.1 | |||
Provenance.
These figures were produced by the research pass recorded as
Gemini (Tier 2 (reasoned), q=76), last refreshed
11 October 2026.
They are researched estimates drawn from public sources, not a licensed data feed.
Each component is scored against fixed published endpoints, so this number is comparable with any other city and does not move as the dataset grows. Scoring framework 2026.10 — full methodology, weights and accepted ranges.

Featured Events
Happening in Prescott
Featured and sponsored events in Prescott.
Local Directory
Businesses in Prescott
Featured local businesses in Prescott.

Performance
Quality Scores
Expenses
Cost of Living
The cost of living in Prescott is slightly above the national average, driven primarily by housing market pressures and high demand from incoming residents. While everyday expenses such as groceries and utilities align closely with or remain slightly below typical U.S. benchmarks, the real estate market significantly impacts overall affordability. Property values and rental rates have experienced notable appreciation over recent years due to limited geographic expansion space constrained by surrounding national forest lands.
Conversely, certain expenses like local transportation and health services remain manageable relative to larger metropolitan centers. Energy bills can fluctuate moderately depending on seasonal heating needs during cooler winter months, though mild year-round temperatures help moderate cooling demands. Overall, residents often trade off higher housing costs for a cleaner environment, lower crime rates, and superior environmental quality of life.
Income
Salary Insights
Prescott features a diversified regional economy with core strengths in healthcare, education, retail trade, and tourism. Major employers include Yavapai Regional Medical Center, Prescott Unified School District, and higher education institutions like Embry-Riddle Aeronautical University and Yavapai College. Government and public sector positions also provide a stable employment foundation for the local workforce, buffering the economy against broader industrial downturns.
The remote work scene has expanded significantly, with a growing cohort of telecommuters relocating to take advantage of the mountain setting and robust fiber-optic infrastructure. While average local wages lag somewhat behind major tech hubs, the rising influx of professional remote workers and small business entrepreneurs has diversified the economic landscape and spurred new growth sectors.
The average salary in Prescott is $58,000 per year. You would need approximately $52,000 to live comfortably.
Employment
Top Industries
Weather
Climate
Mobility
Transport
Getting around Prescott is heavily car-dependent, with most residents relying on personal vehicles for daily commuting and errands. The city layout is accessible via major corridors like Highway 69 and Highway 89, connecting Prescott directly to neighboring Prescott Valley and Interstate 17. Public transit options are limited, though local bus services provide basic coverage for key commercial corridors.
Walkability is high in and around the historic downtown square, where retail shops, dining, and government offices cluster tightly together. Average commute times remain relatively short at around 24 to 28 minutes, shielding residents from the severe traffic congestion plaguing larger metropolitan regions.

At a Glance
Pros & Cons
Advantages
Drawbacks
Head to Head
Compare Prescott
Community Q&A
Questions about Prescott
What people ask about living in and moving to Prescott, Arizona.
FAQ
Frequently Asked Questions
Senior Care in Prescott
41 assisted living, nursing & memory care facilities in Prescott.
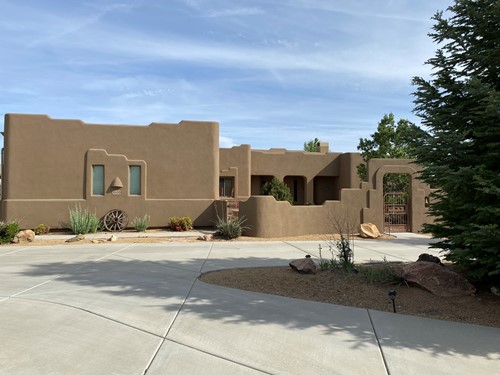 Assisted Living
Circle of Life Alzheimer's Homes
Prescott, AZ
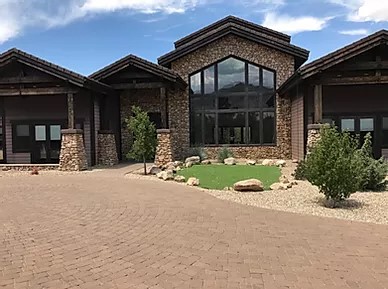 Assisted Living
Circle of Life Alzheimer's Homes
Prescott, AZ
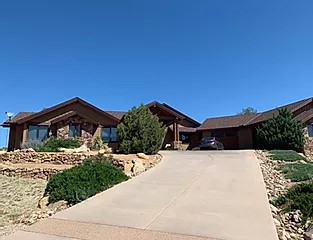 Assisted Living
Circle of Life Alzheimer's Homes
Prescott, AZ
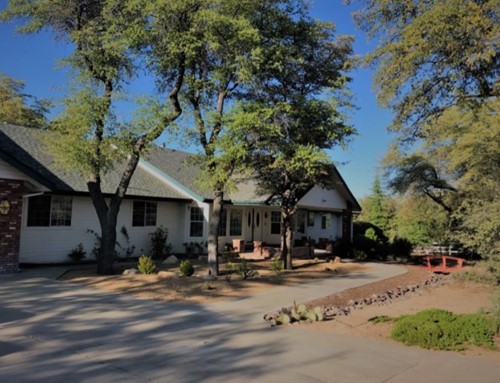 Assisted Living
Summit Senior Living
Prescott, AZ
 Assisted Living
Arizona Angels Prescott
Prescott, AZ
 Assisted Living
Circle of Life Alzheimer's Homes
Prescott, AZ
 Assisted Living
Pleasant Valley Care Home
Prescott, AZ
 Assisted Living
Highgate Senior Living, Prescott
Prescott, AZ
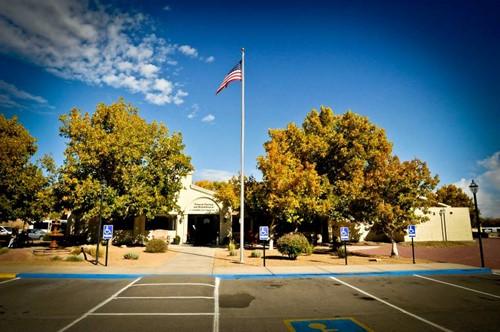 Assisted Living
Prescott Nursing And Rehabilitation Center
Prescott, AZ
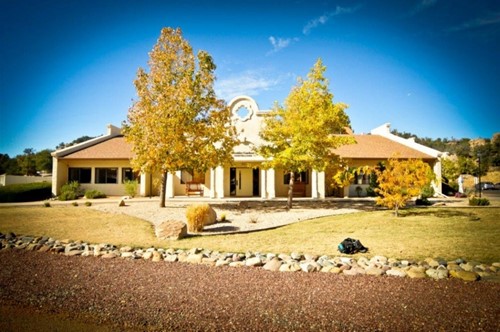 Assisted Living
Boulder Gardens Assisted Living
Prescott, AZ
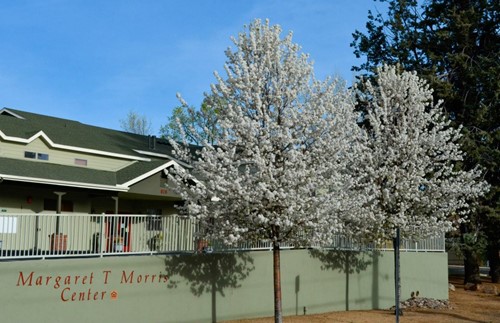 Assisted Living
Margaret T Morris Center
Prescott, AZ
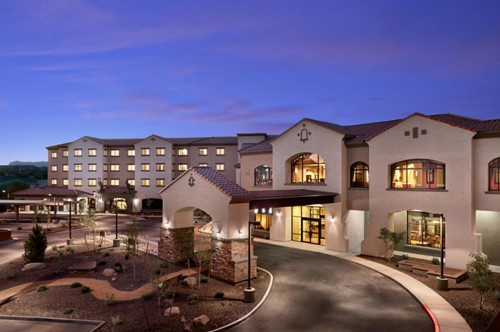 Senior Care
Alta Vista Senior Living Community Prescott
Prescott, AZ
Free Quotes
Get quotes from local pros in Prescott
Tell us what you need and we’ll pass it to companies that serve your area. It’s free, and there’s no obligation.

Compare Prescott with any city
See how it stacks up on cost, income, and quality of life.
Start Comparing