



City Profile
Broomfield, Colorado
USA · Comprehensive city data and intelligence
Broomfield, Colorado, holds a unique position as both a city and county, established in 2001 to streamline governance across its previously multi-county footprint. Strategically located between Denver and Boulder along the US 36 corridor, it offers residents excellent access to major employment centers, educational institutions, and recreational opportunities. The city is known for its commitment to open space, with over 8,000 acres dedicated to trails and nature walks, providing a suburban feel with stunning views of the Rocky Mountains. This blend of urban accessibility and natural beauty makes Broomfield an attractive destination for families, professionals, and outdoor enthusiasts seeking a high quality of life.
Colorado is characterized by its diverse geography, ranging from the Rocky Mountains to the Eastern Plains, offering a lifestyle that blends natural beauty with community charm and extensive outdoor recreation opportunities. The state's economy is robust and diversified, with major industries including aerospace, bioscience, technology, energy and natural resources, financial services, and a strong tourism sector. Living in Colorado is generally more expensive than the national average, with housing costs being a primary driver. The climate is diverse, featuring four distinct seasons with abundant sunshine, though it can experience rapid weather shifts, including hot summers, cold winters, and occasional extreme weather events like flash floods and strong winds.
How this 70/100 was calculated five components, with every reading behind them
| Component | Readings used | Points | Weight | Contributes |
|---|---|---|---|---|
| Safety | Safety score: 72 / 100 | 72.0 | 30% | 21.6 |
| Affordability | No usable reading — dataset average used | 75.1 | 25% | 18.8 |
| Economy & jobs | Median household income: $123,874 Income needed to live here: no usable reading Unemployment rate: 4% | 75.0 | 20% | 15.0 |
| Growth | Population growth rate: 1.24% Job growth rate: 1.43% | 52.3 | 15% | 7.8 |
| Business climate assessment | Business climate assessment: 68 / 100 | 68.0 | 10% | 6.8 |
| Overall score | 70.0 | |||
Provenance.
These figures were produced by the research pass recorded as
Gemini (Tier 1 (fast), q=87), last refreshed
13 September 2026.
They are researched estimates drawn from public sources, not a licensed data feed.
Each component is scored against fixed published endpoints, so this number is comparable with any other city and does not move as the dataset grows. Scoring framework 2026.10 — full methodology, weights and accepted ranges.

Featured Events
Happening in Broomfield
Featured and sponsored events in Broomfield.
Local Directory
Businesses in Broomfield
Featured local businesses in Broomfield.

Performance
Quality Scores
Expenses
Cost of Living
The cost of living in Broomfield is notably higher than the national average, approximately 20% more. This is primarily driven by housing costs, which are significantly above the national median. While the higher cost of living can be a drawback, it is often offset by higher average salaries and a robust job market within the city. The housing market in Broomfield earns a high score in livability metrics, surpassing national averages in home and rental affordability and appreciation rates, which contributes to local economic activity and job growth.
Weather
Climate
Mobility
Transport
Transportation in Broomfield is largely car-dependent, with a Walk Score of 16 and a Transit Score of 10. In 2024, 58.3% of workers drove alone to work, while 29.9% worked from home. However, Broomfield benefits from its strategic location along the US 36 corridor, which provides direct access to Denver and Boulder. The corridor includes express lanes and the Flatiron Flyer bus rapid transit, offering a more predictable transit option during peak periods. The average commute time for workers in Broomfield is 25.5 minutes, which is efficient for a metropolitan area of its size.

At a Glance
Pros & Cons
Advantages
Drawbacks
Head to Head
Compare Broomfield
Community Q&A
Questions about Broomfield
What people ask about living in and moving to Broomfield, Colorado.
What are the best times of year to move to Broomfield?
Spring and early fall typically offer mild weather, making moving easier. Summers can be hot, and winters may bring snow and ice, which can delay transportation and delivery services. Planning during transitional seasons can reduce logistical challenges.
Is public transit reliable for commuting to Denver?
Public transit options are available, including bus routes that connect to Denver’s metro system. Service frequency varies by time of day, and travel times can be longer during peak hours. Checking the transit authority’s schedule online will help you plan your commute.
How does Broomfield’s cost of living compare to Denver?
Broomfield’s cost of living is slightly lower than Denver’s. Grocery prices are comparable, but utilities and housing tend to be a bit cheaper. Overall, you can expect modest savings on monthly expenses while still enjoying many of the same amenities.
Are there many tech jobs near Broomfield?
The region around Broomfield hosts several tech and logistics companies, especially near major highways. Many professionals commute to Denver or Colorado Springs. Look for listings on regional job boards or local business directories to find openings that match your skill set.
What’s the overall vibe of Broomfield for families?
Broomfield is known for its family‑friendly atmosphere, with a mix of suburban and semi‑urban settings. Residents often cite strong community ties, good schools, and accessible parks. Visiting the city and exploring local neighborhoods can give you a clear sense of the community feel.
What’s the average price for a single-family home in Broomfield?
Single-family homes in Broomfield typically range from the mid-$300,000s to the low-$500,000s, depending on size and location. Prices can vary by neighborhood, so checking local real‑estate listings or contacting a realtor who specializes in the area will give you the most accurate, up‑to‑date information.
How are the public schools in Broomfield rated?
Public schools in the area are generally well-regarded, with many receiving above‑average ratings. They offer a range of programs, including STEM and arts. Check the district’s official website for recent performance reports and school‑specific data.
What is Broomfield’s safety score and how does it compare to other cities?
Broomfield has a safety score of 72.0 out of 100, which is moderate compared to nearby cities. This score reflects crime rates, emergency services response times, and community policing efforts. For detailed crime statistics, consult the city’s public safety reports or local law‑enforcement publications.
What kind of medical facilities are in Broomfield?
The city hosts several clinics and a regional medical center that provide primary care, emergency services, and specialty treatments. For detailed services and provider lists, visit the city’s health department website or consult local medical directories.
What recreational activities are popular in Broomfield?
Broomfield offers a mix of parks, trails, and community centers that host sports leagues, festivals, and cultural events. The local recreation department maintains a calendar of activities, and many residents enjoy hiking, biking, and seasonal festivals.
Some answers here were drafted as a starting point and may be out of date. Live in Broomfield? Add your own.
FAQ
Frequently Asked Questions
Senior Care in Broomfield
13 assisted living, nursing & memory care facilities in Broomfield.
 Senior Care
Broomfield Senior Center
Broomfield, CO
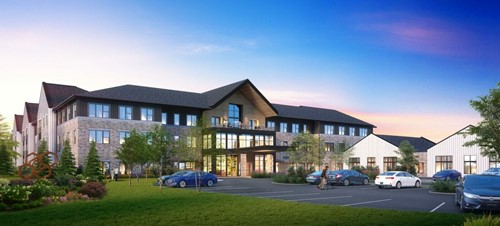 Senior Care
The Gallery at Broomfield (OPENING SPRING 2023)
Broomfield, CO
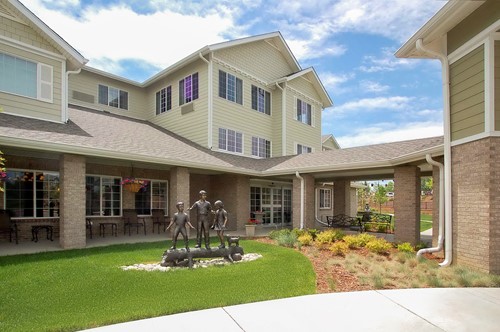 Senior Care
Highland Trail
Broomfield, CO
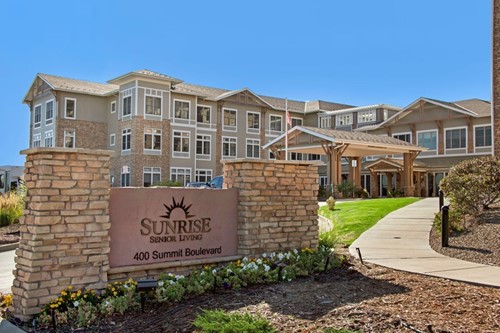 Senior Care
Sunrise at FlatIrons
Broomfield, CO
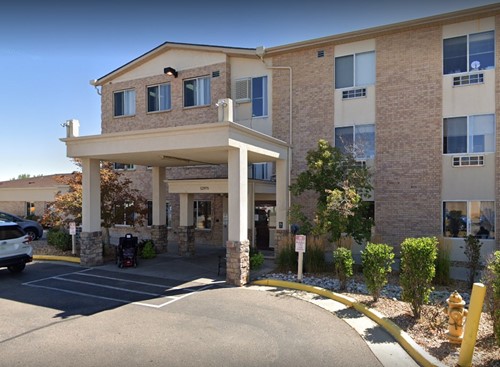 Assisted Living
Adara Living
Broomfield, CO
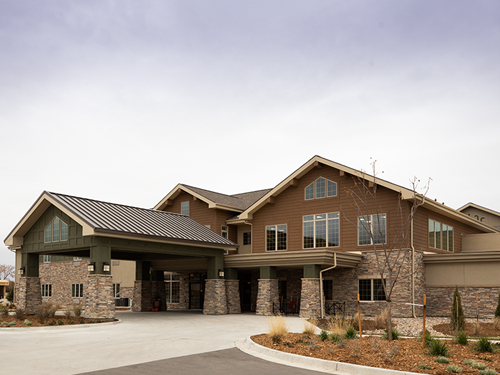 Assisted Living
Legend at Broomfield
Broomfield, CO
BrightStar Care - Boulder / Broomfield
Broomfield, CO
Complete Home Health Care LLC
Broomfield, CO
Visiting Angels - Westminster
Broomfield, CO
Talem Home Care
Broomfield, CO
Compassionate Hospice Care LLC
Broomfield, CO
Compassionate Home Health Care LLC
Broomfield, CO
Free Quotes
Get quotes from local pros in Broomfield
Tell us what you need and we’ll pass it to companies that serve your area. It’s free, and there’s no obligation.

Compare Broomfield with any city
See how it stacks up on cost, income, and quality of life.
Start Comparing