



City Profile
Thornton, Colorado
USA · Comprehensive city data and intelligence
Thornton, Colorado is a vibrant, rapidly expanding home rule city located primarily in Adams County, just 10 miles north of downtown Denver along the Interstate 25 corridor. Established in 1956 and named after former Colorado Governor Dan Thornton, the community has evolved from a quiet post-war suburb into the sixth-most-populous city in the state. Known for its exceptional master-planned neighborhoods, expansive park systems, and striking views of the Rocky Mountains, Thornton attracts diverse families, professionals, and retirees looking for a balanced Colorado lifestyle.
Colorado is characterized by its diverse geography, ranging from the Rocky Mountains to the Eastern Plains, offering a lifestyle that blends natural beauty with community charm and extensive outdoor recreation opportunities. The state's economy is robust and diversified, with major industries including aerospace, bioscience, technology, energy and natural resources, financial services, and a strong tourism sector. Living in Colorado is generally more expensive than the national average, with housing costs being a primary driver. The climate is diverse, featuring four distinct seasons with abundant sunshine, though it can experience rapid weather shifts, including hot summers, cold winters, and occasional extreme weather events like flash floods and strong winds.
How this 64/100 was calculated five components, with every reading behind them
| Component | Readings used | Points | Weight | Contributes |
|---|---|---|---|---|
| Safety | Safety score: 72 / 100 | 72.0 | 30% | 21.6 |
| Affordability | Cost of living index (100 = national baseline): 105.0 | 37.5 | 25% | 9.4 |
| Economy & jobs | Median household income: $103,088 Income needed to live here: $62,000 Unemployment rate: 4.2% | 86.3 | 20% | 17.3 |
| Growth | Population growth rate: 1.05% Job growth rate: 2.2% | 57.6 | 15% | 8.6 |
| Business climate assessment | Business climate assessment: 70 / 100 | 70.0 | 10% | 7.0 |
| Overall score | 63.9 | |||
Provenance.
These figures were produced by the research pass recorded as
Tier 2 (reasoned) (q=68, partial — below threshold), last refreshed
11 October 2026.
They are researched estimates drawn from public sources, not a licensed data feed.
Each component is scored against fixed published endpoints, so this number is comparable with any other city and does not move as the dataset grows. Scoring framework 2026.10 — full methodology, weights and accepted ranges.

Featured Events
Happening in Thornton
Featured and sponsored events in Thornton.
Local Directory
Businesses in Thornton
Featured local businesses in Thornton.

Performance
Quality Scores
Expenses
Cost of Living
The cost of living in Thornton runs slightly above the national average, driven largely by regional housing demand and the overall economic growth of the Denver-Aurora metropolitan area. While everyday expenses like groceries and utilities track fairly close to typical U.S. benchmarks, housing costs—both for purchasing single-family homes and renting apartments—remain the primary pressure point for residents. Even so, Thornton generally offers a more attainable alternative compared to neighboring Boulder or core Denver real estate markets.
Income
Salary Insights
Thornton hosts a dynamic and resilient economy supported by extensive retail centers, healthcare facilities, distribution hubs, and advanced services. Major employers such as King Soopers, Walmart, and specialty manufacturing and logistics operations anchor a robust commercial base along major thoroughfares like I-25 and E-470. Furthermore, proximity to the broader Denver-Boulder tech and aerospace ecosystem allows many residents to easily commute or participate in high-paying regional sectors.
The average salary in Thornton is $78,000 per year. You would need approximately $62,000 to live comfortably.
Employment
Top Industries
Weather
Climate
Mobility
Transport
Getting around Thornton relies heavily on personal vehicle transit, facilitated by key routes like I-25, Highway 7, and E-470, though public transit options continue to mature. The Regional Transportation District (RTD) serves the area with regional bus routes and commuter rail services via stations along the N Line (FasTracks), connecting commuters directly to downtown Denver. Pedestrian and bike connectivity are heavily emphasized in newer developments, though older suburban pockets remain car-dependent.

At a Glance
Pros & Cons
Advantages
Drawbacks
Head to Head
Compare Thornton
Community Q&A
Questions about Thornton
What people ask about living in and moving to Thornton, Colorado.
FAQ
Frequently Asked Questions
Senior Care in Thornton
11 assisted living, nursing & memory care facilities in Thornton.
 Senior Care
Blessings Senior Services
Thornton, CO
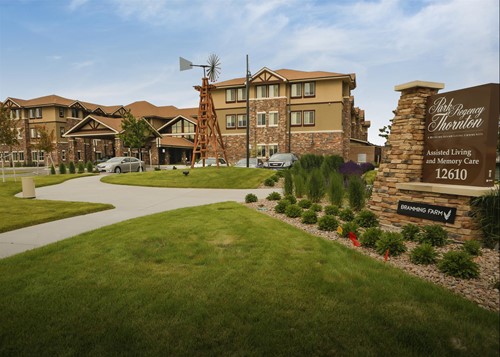 Assisted Living
Park Regency Thornton
Thornton, CO
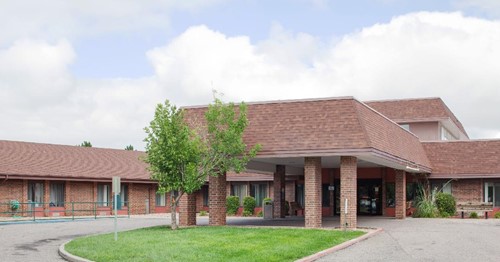 Assisted Living
Elms Haven Center
Thornton, CO
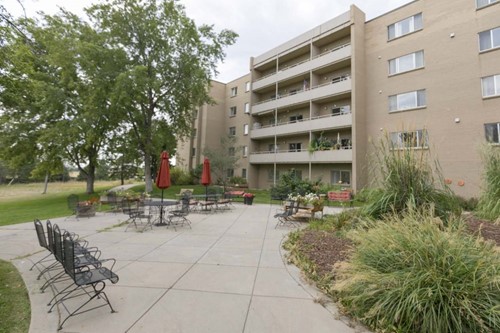 Senior Care
The Villas At Sunny Acres
Thornton, CO
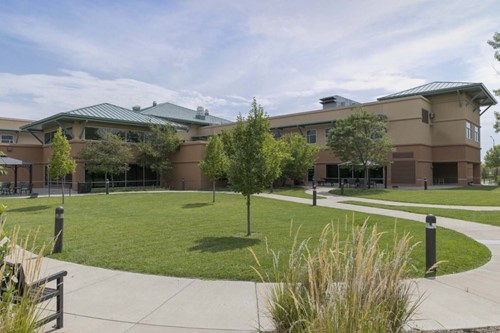 Assisted Living
The Villas At Sunny Acres
Thornton, CO
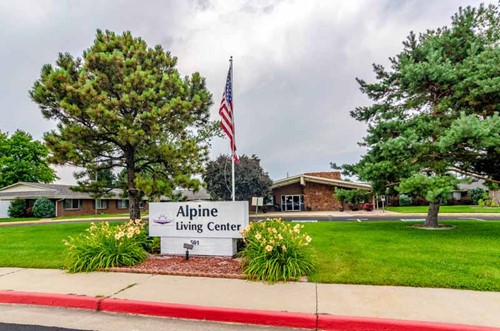 Assisted Living
Ardent Health And Rehabilitation Center
Thornton, CO
Thornton Assisted Living and Memory Care
Thornton, CO
Home Helpers Home Care - Thornton
Thornton, CO
Human Touch Home Health Care Agency Delta
Thornton, CO
Vista View Care Center
Thornton, CO
Dignity Hospice Of Colorado LLC
Thornton, CO
Free Quotes
Get quotes from local pros in Thornton
Tell us what you need and we’ll pass it to companies that serve your area. It’s free, and there’s no obligation.

Compare Thornton with any city
See how it stacks up on cost, income, and quality of life.
Start Comparing