



City Profile
Springfield, Illinois
USA · Comprehensive city data and intelligence
Springfield, Illinois, serves as the vibrant capital city of the state and the county seat of Sangamon County. Steeped in deep American history, the city is world-renowned as the long-time home of Abraham Lincoln, featuring iconic landmarks such as the Abraham Lincoln Presidential Library and Museum and his historic family home. Beyond its rich heritage, Springfield functions as a major administrative, healthcare, and commercial hub for central Illinois, offering residents a blend of small-town charm and steady urban amenities. People are drawn to Springfield for its historic character, strong community identity, and remarkably reasonable cost of living compared to larger metropolitan centers.
Illinois, known as the "Prairie State," offers a diverse character ranging from the bustling metropolis of Chicago to expansive farmlands. Its economy is among the largest and most diversified in the U.S., with major industries including advanced manufacturing, agriculture and food processing, life sciences, technology, and transportation and logistics. While the cost of living statewide is generally considered moderate, housing costs in Chicago can be higher than the national average. Illinois experiences all four seasons, with hot, humid summers and cold, snowy winters, and is susceptible to severe storms and tornadoes, particularly in spring. Residents enjoy a lifestyle that balances world-class cultural amenities and career opportunities with challenges such as high taxes and urban congestion.
How this 59/100 was calculated five components, with every reading behind them
| Component | Readings used | Points | Weight | Contributes |
|---|---|---|---|---|
| Safety | Safety score: 65 / 100 | 65.0 | 30% | 19.5 |
| Affordability | Cost of living index (100 = national baseline): 93.0 | 52.5 | 25% | 13.1 |
| Economy & jobs | Median household income: $66,064 Income needed to live here: $52,000 Unemployment rate: 4.1% | 66.3 | 20% | 13.3 |
| Growth | Population growth rate: no usable reading Job growth rate: 1.1% | 42.0 | 15% | 6.3 |
| Business climate assessment | Business climate assessment: 67 / 100 | 67.0 | 10% | 6.7 |
| Overall score | 58.9 | |||
Provenance.
These figures were produced by the research pass recorded as
Gemini (ungrounded) (q=55, partial — below threshold), last refreshed
11 October 2026.
They are researched estimates drawn from public sources, not a licensed data feed.
Each component is scored against fixed published endpoints, so this number is comparable with any other city and does not move as the dataset grows. Scoring framework 2026.10 — full methodology, weights and accepted ranges.

Featured Events
Happening in Springfield
Featured and sponsored events in Springfield.
Local Directory
Businesses in Springfield
Featured local businesses in Springfield.

Performance
Quality Scores
Expenses
Cost of Living
The cost of living in Springfield is distinctly lower than the national average, making it an attractive destination for families, professionals, and retirees seeking financial breathing room. Housing expenses, in particular, remain well below national medians, allowing residents to purchase larger homes or secure rental units at a fraction of the cost found in Chicago or national coastal markets. Everyday goods, utilities, and transportation expenses also track below national benchmarks, supported by regional economic pricing that eases the financial pressure on middle-and lower-income households.
Income
Salary Insights
Springfield's economy is anchored by government administration, healthcare systems, and insurance enterprises, providing a stable employment base. Major employers include the State of Illinois, Memorial Health, and HSHS St. John's Hospital, which drive steady demand for administrative, professional, and medical occupations. While heavy manufacturing plays a smaller role, the region has fostered a growing entrepreneurial ecosystem and reliable service sectors. The remote work scene is also expanding as professionals take advantage of affordable housing and robust local broadband infrastructure.
The average salary in Springfield is $69,000 per year. You would need approximately $52,000 to live comfortably.
Employment
Top Industries
Weather
Climate
Mobility
Transport
Getting around Springfield is primarily car-dependent, with most residents commuting via personal vehicles over relatively short average travel times. The Sangamon Mass Transit District (SMTD) provides public bus services across the city, though routes are most concentrated around central corridors. Walkability and bike infrastructure are moderate in downtown and historic neighborhoods, but vehicular transport remains the dominant and most efficient mode of travel.

At a Glance
Pros & Cons
Advantages
Drawbacks
Head to Head
Compare Springfield
Community Q&A
Questions about Springfield
What people ask about living in and moving to Springfield, Illinois.
FAQ
Frequently Asked Questions
Businesses for Sale in Springfield
Explore active acquisition & franchise opportunities .
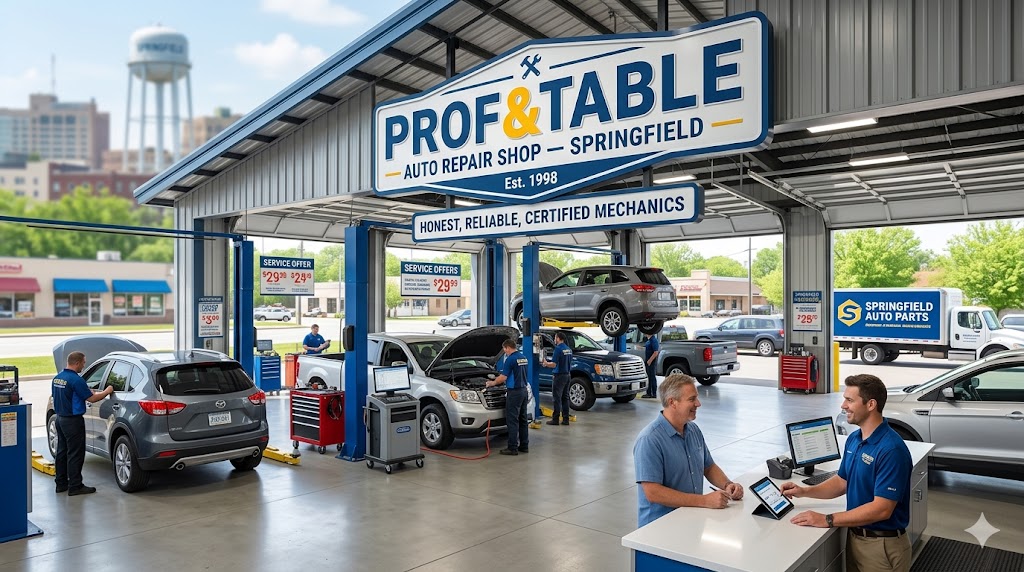 Independent
Profitable Auto Repair Shop for Sale – Springfield
Springfield, Missouri
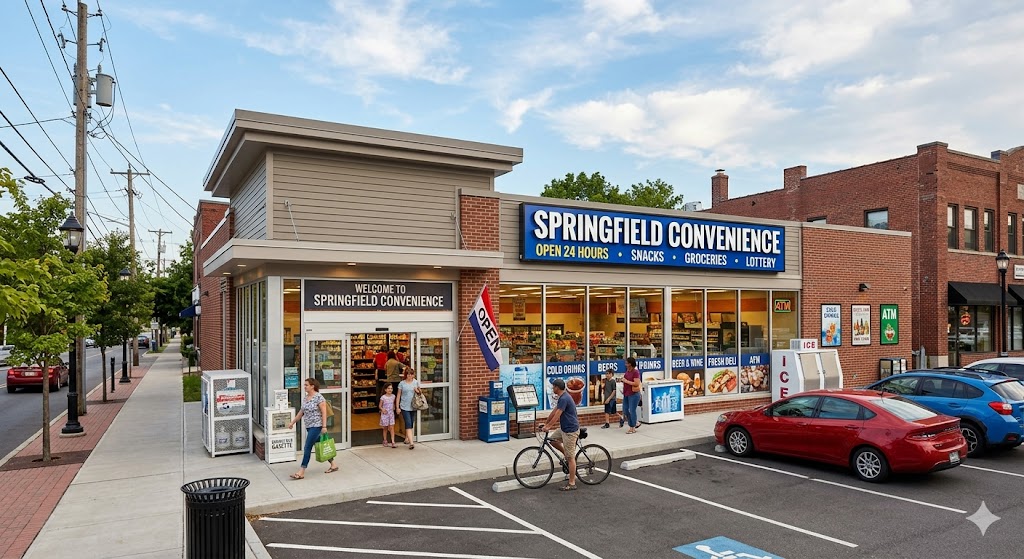 Business for Sale
Retail Convenience Store for Sale – Springfield
Springfield, Massachusetts
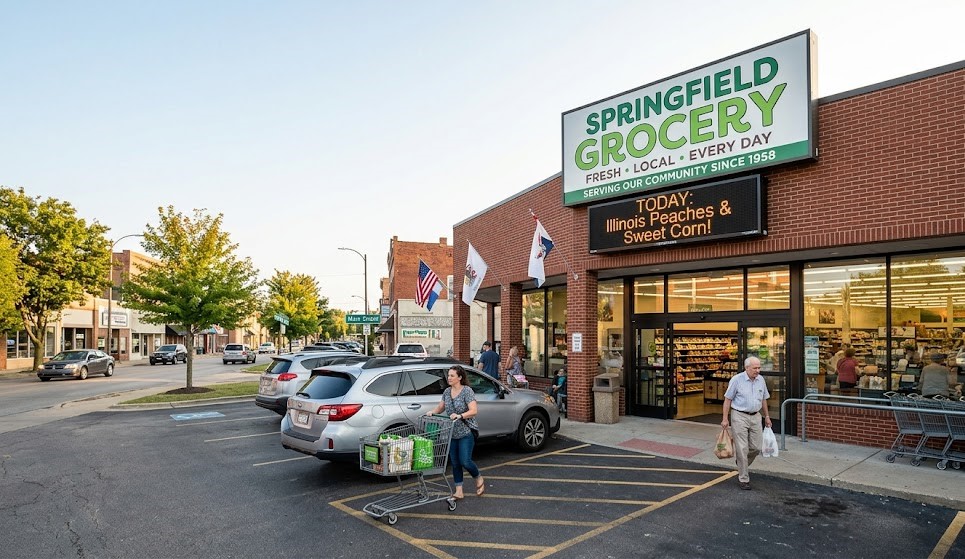 Independent
Retail Grocery Store for Sale – Springfield
Springfield, Illinois
Senior Care in Springfield
29 assisted living, nursing & memory care facilities in Springfield.
 Senior Care
Season Under the Oaks
Springfield, IL
 Senior Care
Christian Horizons
Springfield, IL
 Senior Care
Springfield Supportive Living Center
Springfield, IL
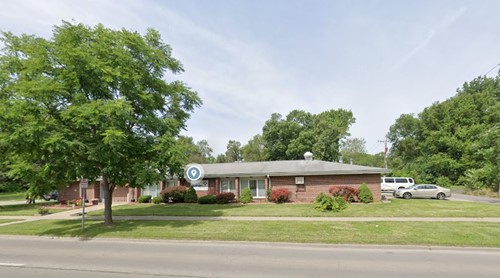 Assisted Living
Aperion Care Springfield
Springfield, IL
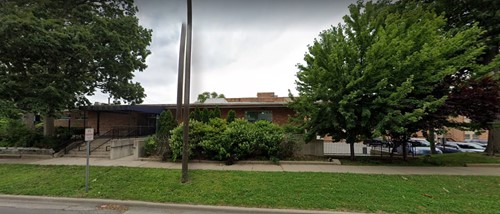 Assisted Living
Aperion Care Capitol
Springfield, IL
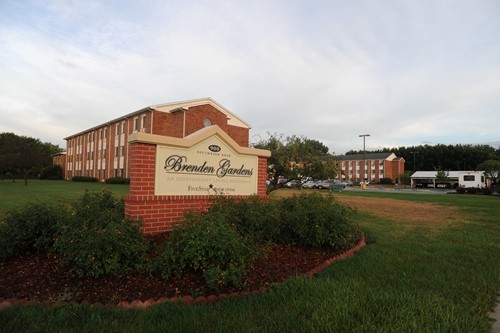 Senior Care
Brenden Gardens
Springfield, IL
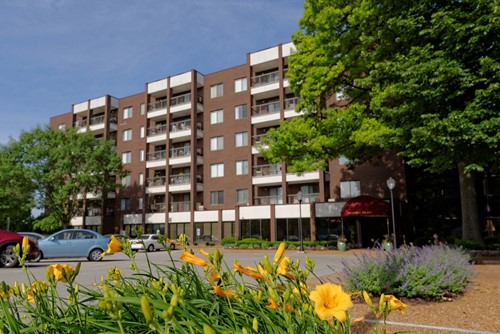 Senior Care
Hickory Glen
Springfield, IL
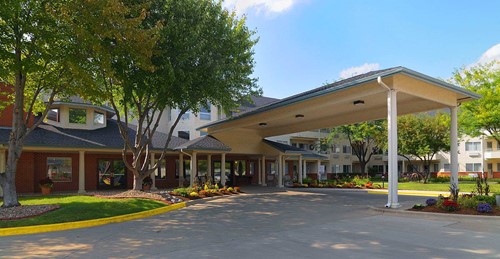 Senior Care
Montvale Estates
Springfield, IL
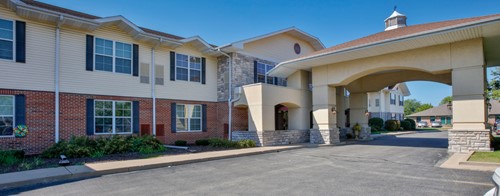 Senior Care
Bickford of Springfield
Springfield, IL
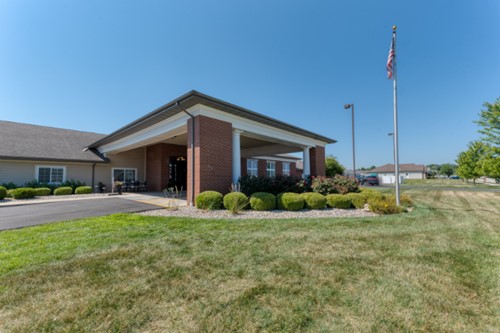 Assisted Living
Cedarhurst of Springfield, IL
Springfield, IL
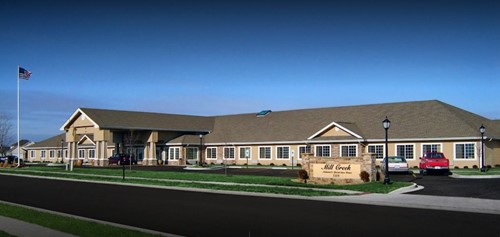 Assisted Living
Mill Creek Alzheimer's Special Care Center
Springfield, IL
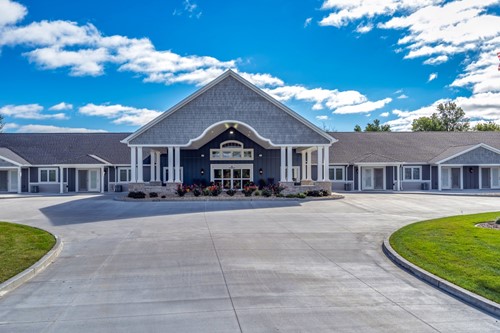 Assisted Living
Villas of Holly Brook and Reflections Springfield, Illinois
Springfield, IL
City Guide
Explore Springfield
Free Quotes
Get quotes from local pros in Springfield
Tell us what you need and we’ll pass it to companies that serve your area. It’s free, and there’s no obligation.

Compare Springfield with any city
See how it stacks up on cost, income, and quality of life.
Start Comparing