



City Profile
Indianapolis, Indiana
USA · Comprehensive city data and intelligence
Indianapolis, often referred to as Indy, is the capital and most populous city of Indiana, situated on the White River in central Indiana. Known for its rich history in motorsports, particularly the iconic Indianapolis 500, the city has evolved into a vibrant metropolitan hub with a diverse economy and a growing population. It serves as a major center for logistics, healthcare, and technology in the Midwest. People are drawn to Indianapolis for its relatively affordable cost of living, a strong sense of community, and a blend of urban amenities with Midwestern charm. The city's commitment to urban development, green spaces like the Cultural Trail, and a burgeoning culinary scene contribute to its appeal as a place to live and work.
Indiana, known as the "Hoosier State," offers a practical and community-oriented lifestyle with a cost of living generally below the national average. Its economy is diverse, with major industries including advanced manufacturing (automotive, steel, pharmaceuticals, medical devices), agriculture (corn, soybeans, hogs), life sciences, and logistics. The state experiences a humid continental climate, characterized by hot, muggy summers and cold, snowy winters, with spring and fall offering more moderate temperatures. Residents often value a relaxed pace of life, strong community ties, and access to outdoor activities and major metropolitan areas.
How this 53/100 was calculated five components, with every reading behind them
| Component | Readings used | Points | Weight | Contributes |
|---|---|---|---|---|
| Safety | Safety score: 44 / 100 | 44.0 | 30% | 13.2 |
| Affordability | Cost of living index (100 = national baseline): 90.0 | 56.3 | 25% | 14.1 |
| Economy & jobs | Median household income: $66,219 Income needed to live here: $55,000 Unemployment rate: 3.4% | 66.5 | 20% | 13.3 |
| Growth | Population growth rate: 0.33% Job growth rate: 0.7% | 33.6 | 15% | 5.0 |
| Business climate assessment | Business climate assessment: 70 / 100 | 70.0 | 10% | 7.0 |
| Overall score | 52.6 | |||
Provenance.
These figures were produced by the research pass recorded as
Gemini (Tier 3 (deep think), q=88), last refreshed
19 August 2026.
They are researched estimates drawn from public sources, not a licensed data feed.
Each component is scored against fixed published endpoints, so this number is comparable with any other city and does not move as the dataset grows. Scoring framework 2026.10 — full methodology, weights and accepted ranges.

Featured Events
Happening in Indianapolis
Featured and sponsored events in Indianapolis.
Local Directory
Businesses in Indianapolis
Featured local businesses in Indianapolis.

Performance
Quality Scores
Expenses
Cost of Living
The cost of living in Indianapolis is notably more affordable than the national average, making it an attractive option for individuals and families. As of August 2026, the overall cost of living in Indianapolis is approximately 10.3% lower than the U.S. average. Housing is a significant factor contributing to this affordability, with average rents and home prices remaining below national benchmarks. While utilities, groceries, and transportation costs are generally in line with or slightly below the national average, the lower housing expenses significantly drive down the overall cost of living. This affordability allows residents to allocate more of their income towards savings, entertainment, or other discretionary spending, enhancing their financial well-being.
Income
Salary Insights
Indianapolis boasts a robust and diversified economy, with key sectors driving job growth and innovation. Top industries include Healthcare & Life Sciences, Logistics & Transportation, Advanced Manufacturing, Information Technology, and Hospitality & Tourism. The metropolitan area is home to major employers in pharmaceuticals like Eli Lilly and logistics giants such as FedEx and Amazon. While the Indianapolis metropolitan area saw job growth of 2.2% in 2024, with an average annual growth forecast of 0.7% for 2025 through 2028, the city experienced a monthly average loss of 992 jobs in 2025, followed by an average gain of 150 jobs per month in 2026. The average annual salary in Indianapolis was reported at $76,000 in July 2026.
The average salary in Indianapolis is $76,000 per year. You would need approximately $55,000 to live comfortably.
Employment
Top Industries
Weather
Climate
Mobility
Transport
Getting around Indianapolis primarily relies on personal vehicles, as it is largely considered a car-dependent city. The average commute time in Central Indiana is around 24.6 minutes. While public transit options exist through IndyGo, including the Red Line, walkability is concentrated in specific areas like Downtown Indianapolis and Fountain Square, which boast higher walk scores. Outside these core areas, the urban sprawl necessitates car usage for most daily activities. Traffic congestion has been a growing concern, with commuters losing an average of 50 hours annually to traffic in 2024.

At a Glance
Pros & Cons
Advantages
Drawbacks
Head to Head
Compare Indianapolis
Community Q&A
Questions about Indianapolis
What people ask about living in and moving to Indianapolis, Indiana.
Is Indianapolis a safe city for families?
The safety score for Indianapolis is 44.0 out of 100, which is lower than many U.S. cities. Crime rates vary by neighborhood, with some areas experiencing higher incidents of property and violent crime. Families often choose neighborhoods with lower crime statistics and good community engagement. Checking recent crime data from the city’s public safety department and speaking with local residents can help you assess...
What healthcare facilities are available near downtown Indianapolis?
Downtown Indianapolis hosts several hospitals and specialty clinics that provide a wide range of medical services, from general practice to advanced surgical care. These facilities are equipped with emergency departments, outpatient services, and specialized treatment centers. For specific locations, visiting the city’s health department website or using a local healthcare directory can help you identify the nearest...
What are some popular cultural attractions in Indianapolis?
Indianapolis offers a vibrant arts and cultural scene, including museums, theaters, and music venues that showcase local and national talent. The downtown area features galleries, performance spaces, and public art installations. Seasonal festivals and farmers markets are common, especially in the warmer months. Checking the city’s tourism website or local event calendars can give you up-to-date information on exhibi...
What is the overall vibe of Indianapolis for young professionals?
Indianapolis has a growing economy with a mix of traditional manufacturing and emerging tech sectors, making it attractive for young professionals. The city offers a range of dining, nightlife, and outdoor recreation options, especially along the riverfront and in parks. The cost of living is moderate, and the downtown area features lofts and mixed-use developments that cater to a younger crowd. Community events, pro...
How does the cost of living in Indianapolis compare to the national average?
The cost of living index in Indianapolis is 90, which is 10 points below the national average of 100. This means everyday expenses such as groceries, utilities, and transportation are generally 10% lower than the U.S. average. Housing costs are a major factor, with the average rent around $1,123 per month, slightly below many other mid-sized U.S. cities. Overall, your budget should have a little more flexibility, but...
How are the public schools in Indianapolis ranked?
Public schools in Indianapolis are managed by a large city school district that offers a range of programs from elementary to high school. Performance varies by school; some are highly rated while others need improvement. Parents can review school performance reports, student-teacher ratios, and extracurricular offerings on the district’s official website. Additionally, community forums and local parent groups often...
What is the average rent for a one-bedroom apartment in Indianapolis?
The average rent for a one-bedroom apartment in Indianapolis is about $1,123 per month. This figure reflects the typical market rate for a modest unit in the city. Prices can vary by neighborhood and proximity to downtown or university areas. To get a precise estimate, look up current listings on local real estate websites or contact a real estate agent who specializes in the Indianapolis market.
What public transportation options are available for commuting in Indianapolis?
The city offers a public transit system that includes buses covering most of the metropolitan area. While there is no rapid rail network, the bus service connects key employment centers, universities, and residential neighborhoods. Buses run on fixed routes and schedules, with some express lines during peak hours. For detailed route maps, schedules, and fare information, consult the city transit authority’s website o...
What should I know about moving my furniture into Indianapolis apartments?
When moving into an Indianapolis apartment, consider the building’s parking policies, storage options, and move-in restrictions such as window lockouts or elevator reservations. Many apartments allow moving on weekends to avoid traffic congestion. It’s also wise to confirm the availability of loading docks or designated move-in times. Contacting the property manager ahead of your move can help you schedule a convenie...
What is the average salary for tech jobs in Indianapolis?
The average salary in Indianapolis is $76,000 per year, which is slightly below the national average for tech roles. However, many tech positions in the city offer competitive benefits and opportunities for growth. Salaries can vary widely based on experience, company size, and specific technical skills. To gauge current market rates, consult local job boards, salary surveys, and professional networking groups focuse...
Some answers here were drafted as a starting point and may be out of date. Live in Indianapolis? Add your own.
FAQ
Frequently Asked Questions
Related
Insights about Indianapolis
Businesses for Sale in Indianapolis
Explore active acquisition & franchise opportunities .
Senior Care in Indianapolis
149 assisted living, nursing & memory care facilities in Indianapolis.
 Senior Care
ABBEY APARTMENTS
Indianapolis, IN
 Senior Care
Tender Care Home Health and Hospice
Indianapolis, IN
 Senior Care
Active Senior Home Care
Indianapolis, IN
 Senior Care
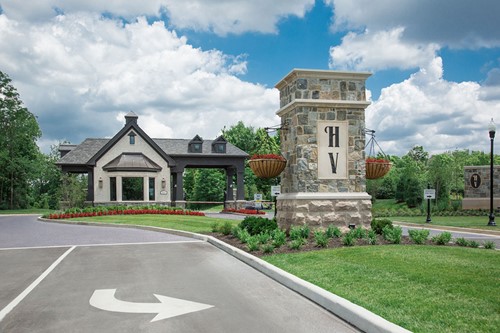
Hoosier Village - Independent Living, Assisted Living and Me...
Indianapolis, IN
 Assisted Living
Hoosier Village
Indianapolis, IN
 Senior Care
Sycamore Reserve Senior Living
Indianapolis, IN
 Assisted Living
Rittenhouse Village At Northside
Indianapolis, IN
 Assisted Living
Crown Senior Living
Indianapolis, IN
 Senior Care
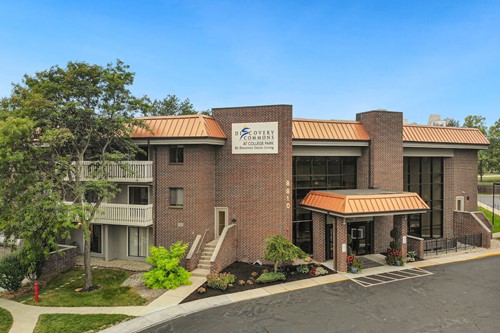
Discovery Commons at College Park
Indianapolis, IN
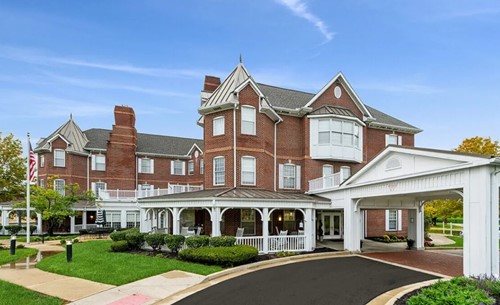 Assisted Living
Willow Lake Place
Indianapolis, IN
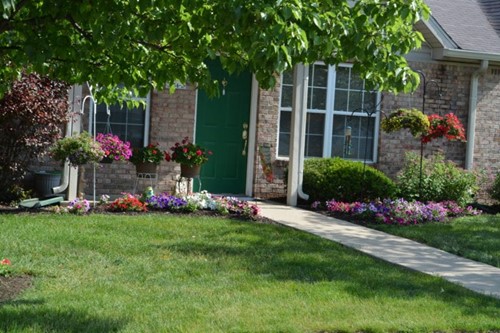 Senior Care
Spring Mill Meadows Garden Homes
Indianapolis, IN
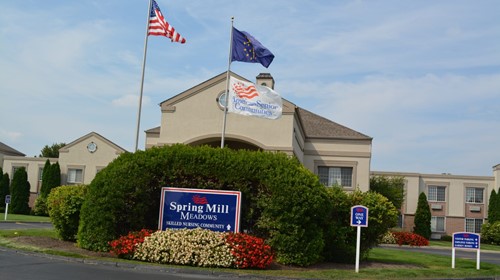 Assisted Living
Spring Mill Meadows
Indianapolis, IN
City Guide
Explore Indianapolis
Free Quotes
Get quotes from local pros in Indianapolis
Tell us what you need and we’ll pass it to companies that serve your area. It’s free, and there’s no obligation.

Compare Indianapolis with any city
See how it stacks up on cost, income, and quality of life.
Start Comparing