



City Profile
Mishawaka, Indiana
USA · Comprehensive city data and intelligence
Mishawaka, Indiana, affectionately known as the 'Princess City,' is situated along the banks of the scenic St. Joseph River in St. Joseph County. Founded in the 1830s through the merger of two rival settlements, the community grew rapidly on the back of manufacturing, water power, and brass industries, eventually developing a distinct industrial character separate from neighboring South Bend. Today, it combines a rich manufacturing heritage with vibrant modern commercial hubs like the Grape Road shopping corridor, making it a prominent retail and residential center in north-central Indiana.
People are drawn to Mishawaka for its unique blend of urban conveniences and small-town Midwestern charm. The city features beautifully maintained historic neighborhoods, a revitalized downtown riverfront district, and expansive park systems that offer residents plenty of recreational space. Its strategic location right along major transportation routes provides easy access to larger metropolitan areas like Chicago while maintaining a tight-knit community atmosphere.
Indiana, known as the "Hoosier State," offers a practical and community-oriented lifestyle with a cost of living generally below the national average. Its economy is diverse, with major industries including advanced manufacturing (automotive, steel, pharmaceuticals, medical devices), agriculture (corn, soybeans, hogs), life sciences, and logistics. The state experiences a humid continental climate, characterized by hot, muggy summers and cold, snowy winters, with spring and fall offering more moderate temperatures. Residents often value a relaxed pace of life, strong community ties, and access to outdoor activities and major metropolitan areas.
How this 61/100 was calculated five components, with every reading behind them
| Component | Readings used | Points | Weight | Contributes |
|---|---|---|---|---|
| Safety | Safety score: 71 / 100 | 71.0 | 30% | 21.3 |
| Affordability | Cost of living index (100 = national baseline): 92.0 | 53.8 | 25% | 13.4 |
| Economy & jobs | Median household income: $54,291 Income needed to live here: $48,000 Unemployment rate: 4.1% | 57.6 | 20% | 11.5 |
| Growth | Population growth rate: 0.27% Job growth rate: 2.6% | 51.9 | 15% | 7.8 |
| Business climate assessment | Business climate assessment: 70 / 100 | 70.0 | 10% | 7.0 |
| Overall score | 61.0 | |||
Provenance.
These figures were produced by the research pass recorded as
Gemini (Tier 3 (deep think), q=70), last refreshed
11 October 2026.
They are researched estimates drawn from public sources, not a licensed data feed.
Each component is scored against fixed published endpoints, so this number is comparable with any other city and does not move as the dataset grows. Scoring framework 2026.10 — full methodology, weights and accepted ranges.

Featured Events
Happening in Mishawaka
Featured and sponsored events in Mishawaka.
Local Directory
Businesses in Mishawaka
Featured local businesses in Mishawaka.

Performance
Quality Scores
Expenses
Cost of Living
The cost of living in Mishawaka is notably lower than the national average, making it an attractive destination for families, young professionals, and retirees looking to stretch their purchasing power. Housing costs, in particular, remain quite budget-friendly compared to coastal markets and major national hubs, allowing residents to secure comfortable rental units or purchase single-family homes without severe financial strain. Everyday expenses such as groceries, utilities, and local services also track below national norms, cushioning residents against wider inflationary pressures.
Downward pressure on everyday costs is largely driven by modest real estate valuations and competitive utility pricing across northern Indiana. While certain discretionary categories like dining out and entertainment scale with regional trends, the overall cost structure ensures that median household earnings go further here than in typical American suburbs. This economic accessibility is a primary driver behind steady local interest from home-buyers seeking reliable long-term value.
Income
Salary Insights
Mishawaka boasts a diversified and resilient local economy anchored by strong employment sectors in manufacturing, health care and social assistance, and educational services. Major corporate and institutional employers, alongside a robust retail presence along the Grape Road and Main Street corridors, provide steady job availability across various skill levels. Furthermore, the city's strategic integration into the broader South Bend-Mishawaka metropolitan labor market opens up extensive cross-commuting opportunities for specialized professionals.
The remote work scene has also expanded steadily throughout the area, supported by reliable broadband infrastructure and a growing community of hybrid professionals who appreciate the lower overhead costs. Entrepreneurial initiatives and local economic development programs actively foster small business growth, ensuring a dynamic environment for new ventures. With a stable unemployment rate hovering near 4.1%, the job market remains balanced and accommodating for active job seekers.
The average salary in Mishawaka is $56,000 per year. You would need approximately $48,000 to live comfortably.
Employment
Top Industries
Weather
Climate
Mobility
Transport
Getting around Mishawaka is predominantly car-centric, with a network of well-maintained thoroughfares, highways, and easy access to the Interstate 80/90 Toll Road. The vast majority of residents commute via private vehicle, benefiting from average commute times that are notably shorter than the national urban norm. Public transportation is primarily serviced by the Transpo bus system, which connects Mishawaka directly to South Bend and major employment hubs across the county.
Walkability varies by neighborhood; traditional grid-pattern streets near the core downtown areas offer pedestrian-friendly sidewalks, whereas outer retail strips and newer residential subdivisions lean heavily toward vehicular dependency. For regional and national travel, South Bend International Airport is less than a 30-minute drive away, offering daily flights and connectivity via the South Shore commuter rail line directly to downtown Chicago.

At a Glance
Pros & Cons
Advantages
Drawbacks
Head to Head
Compare Mishawaka
Community Q&A
Questions about Mishawaka
What people ask about living in and moving to Mishawaka, Indiana.
FAQ
Frequently Asked Questions
Senior Care in Mishawaka
19 assisted living, nursing & memory care facilities in Mishawaka.
 Senior Care
SouthernCare Hospice of South Bend
Mishawaka, IN
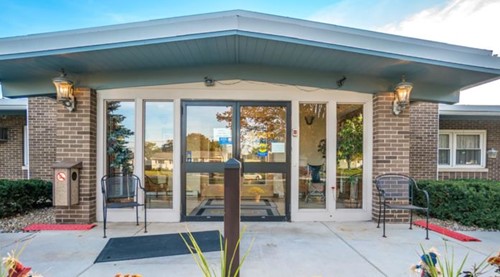 Assisted Living
Golden Living Center-Mishawaka
Mishawaka, IN
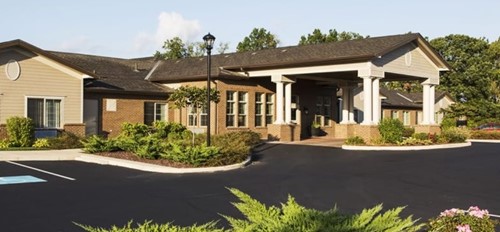 Assisted Living
Heritage Point Retirement Living
Mishawaka, IN
 Assisted Living
Cedarhurst of Edison Lakes
Mishawaka, IN
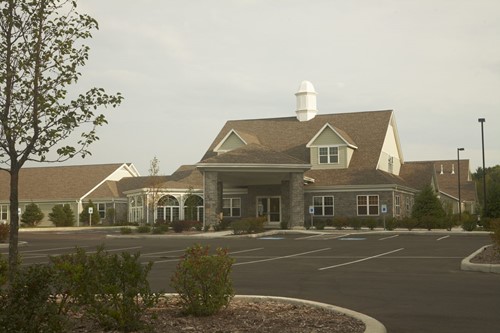 Assisted Living
Creekside Village
Mishawaka, IN
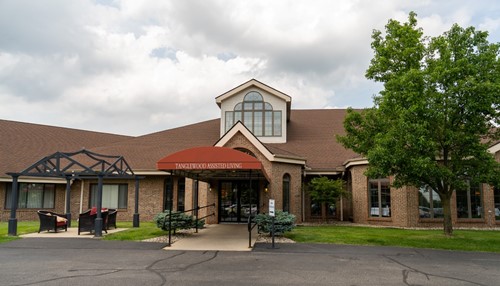 Senior Care
Tanglewood Trace
Mishawaka, IN
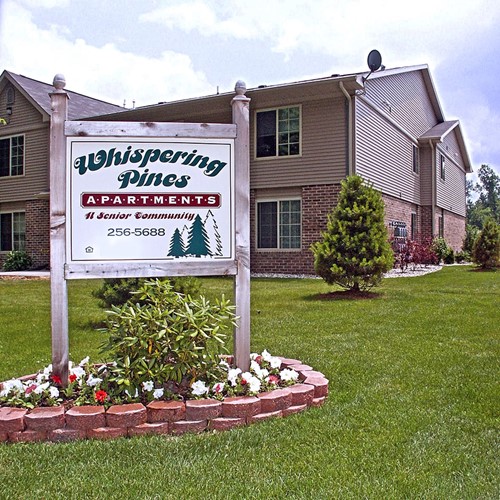 Senior Care
Whispering Pines Apartments
Mishawaka, IN
Caring Cove Hospice LLC
Mishawaka, IN
Southerncare South Bend
Mishawaka, IN
Visiting Angels - Michigan City
Mishawaka, IN
Saint Joseph Vna Home Care
Mishawaka, IN
Home Instead - Mishawaka
Mishawaka, IN
Free Quotes
Get quotes from local pros in Mishawaka
Tell us what you need and we’ll pass it to companies that serve your area. It’s free, and there’s no obligation.

Compare Mishawaka with any city
See how it stacks up on cost, income, and quality of life.
Start Comparing