



City Profile
South Bend, Indiana
USA · Comprehensive city data and intelligence
South Bend, Indiana, located along the bends of the St. Joseph River in the state's northern tier, is a historic industrial hub undergoing a modern renaissance. Best known worldwide as the home of the University of Notre Dame, the city blends its rich manufacturing heritage with a growing focus on technology, innovation, and urban revitalization. In recent years, municipal investments in downtown infrastructure and public spaces have made it an increasingly attractive option for families and young professionals seeking affordability without sacrificing cultural amenities.
Indiana, known as the "Hoosier State," offers a practical and community-oriented lifestyle with a cost of living generally below the national average. Its economy is diverse, with major industries including advanced manufacturing (automotive, steel, pharmaceuticals, medical devices), agriculture (corn, soybeans, hogs), life sciences, and logistics. The state experiences a humid continental climate, characterized by hot, muggy summers and cold, snowy winters, with spring and fall offering more moderate temperatures. Residents often value a relaxed pace of life, strong community ties, and access to outdoor activities and major metropolitan areas.
How this 58/100 was calculated five components, with every reading behind them
| Component | Readings used | Points | Weight | Contributes |
|---|---|---|---|---|
| Safety | Safety score: 62 / 100 | 62.0 | 30% | 18.6 |
| Affordability | Cost of living index (100 = national baseline): 87.0 | 60.0 | 25% | 15.0 |
| Economy & jobs | Median household income: $54,200 Income needed to live here: $48,000 Unemployment rate: 4.2% | 56.8 | 20% | 11.4 |
| Growth | Population growth rate: 0.4% Job growth rate: 1.5% | 42.5 | 15% | 6.4 |
| Business climate assessment | Business climate assessment: 69 / 100 | 69.0 | 10% | 6.9 |
| Overall score | 58.2 | |||
Provenance.
These figures were produced by the research pass recorded as
Gemini (ungrounded) (q=54, partial — below threshold), last refreshed
16 October 2026.
They are researched estimates drawn from public sources, not a licensed data feed.
Each component is scored against fixed published endpoints, so this number is comparable with any other city and does not move as the dataset grows. Scoring framework 2026.10 — full methodology, weights and accepted ranges.

Featured Events
Happening in South Bend
Featured and sponsored events in South Bend.
Local Directory
Businesses in South Bend
Featured local businesses in South Bend.

Performance
Quality Scores
Expenses
Cost of Living
The cost of living in South Bend remains notably lower than the national average, driven primarily by highly affordable housing options. Everyday expenses such as groceries, utilities, and transportation sit well below standard metropolitan indices, allowing residents' incomes to stretch further. While utility costs can fluctuate during the colder winter months, the overall economic climate offers a high purchasing power compared to larger coastal or regional metros.
Income
Salary Insights
South Bend's economy is anchored by healthcare, higher education, advanced manufacturing, and a burgeoning tech and remote work sector. Major employers like Beacon Health System, the University of Notre Dame, and local manufacturing firms provide a stable employment foundation for the region. The city has actively fostered an entrepreneurial spirit, with downtown co-working spaces and innovation hubs supporting local startups and small business growth.
The average salary in South Bend is $56,000 per year. You would need approximately $48,000 to live comfortably.
Employment
Top Industries
Weather
Climate
Mobility
Transport
Getting around South Bend relies predominantly on automobiles, with a layout optimized for driving and relatively manageable traffic congestion during peak hours. The Transpo public transit system provides bus routes connecting key neighborhoods, downtown, and commercial districts, though service frequency varies. For regional and national travel, the South Bend International Airport and nearby rail connections offer convenient access to Chicago and beyond.

At a Glance
Pros & Cons
Advantages
Drawbacks
Head to Head
Compare South Bend
Community Q&A
Questions about South Bend
What people ask about living in and moving to South Bend, Indiana.
FAQ
Frequently Asked Questions
Businesses for Sale in South Bend
Explore active acquisition & franchise opportunities .
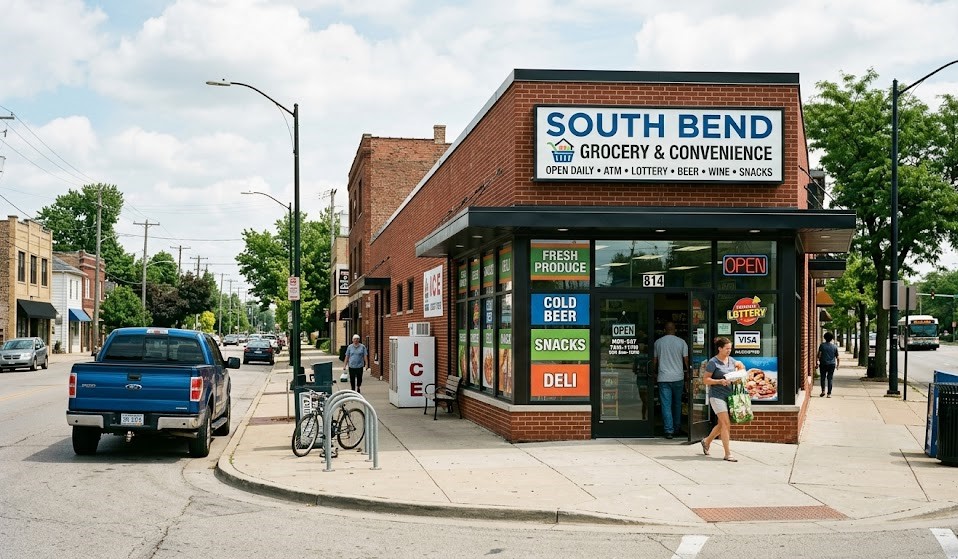
Senior Care in South Bend
24 assisted living, nursing & memory care facilities in South Bend.
 Senior Care
Beacon Medical Group Physical Medicine & Rehabilitation Sout...
South Bend, IN
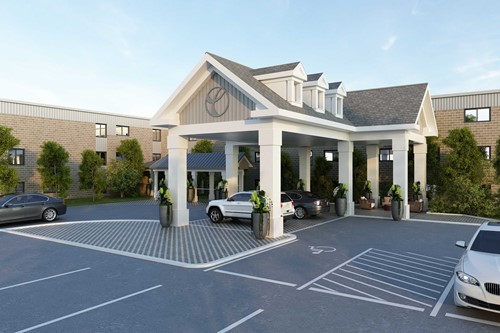 Senior Care
The Pinnacle at St. Paul's
South Bend, IN
 Assisted Living
St Paul's
South Bend, IN
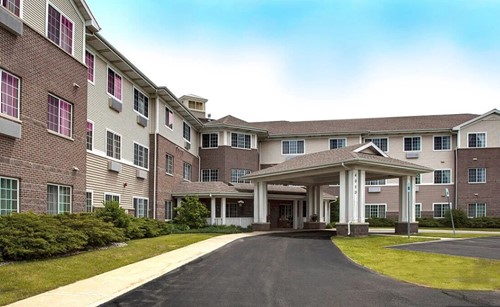 Assisted Living
Grand Emerald Place
South Bend, IN
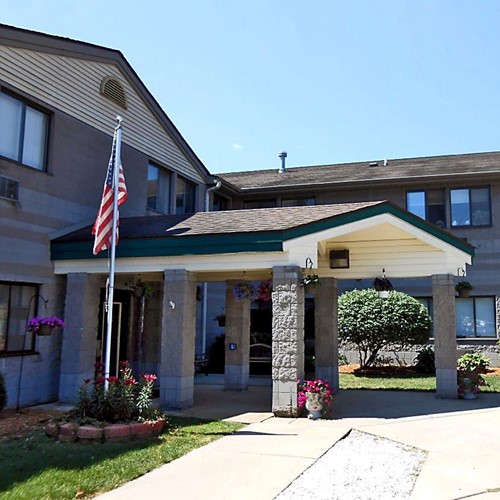 Assisted Living
The Wood Ridge Village
South Bend, IN
 Assisted Living
Trailpoint Village
South Bend, IN
 Senior Care
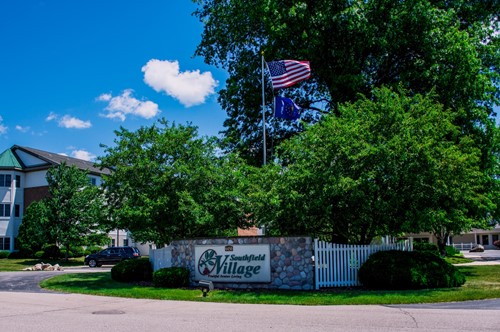
Southfield Village - Independent and Assisted Living
South Bend, IN
 Assisted Living
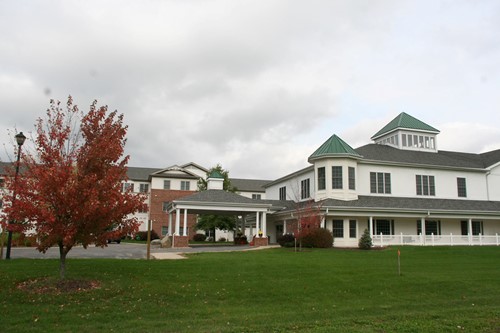
Southfield Village
South Bend, IN
 Assisted Living
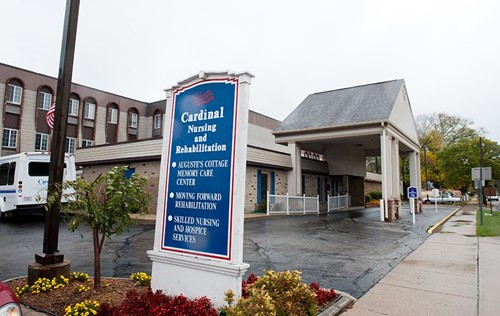
Cardinal Nursing And Rehabilitation Center
South Bend, IN
 Assisted Living
Morningview Assisted Living Residences
South Bend, IN
 Assisted Living
The Milton Home - Assisted Living
South Bend, IN
 Assisted Living
The Milton Home
South Bend, IN
Free Quotes
Get quotes from local pros in South Bend
Tell us what you need and we’ll pass it to companies that serve your area. It’s free, and there’s no obligation.

Compare South Bend with any city
See how it stacks up on cost, income, and quality of life.
Start Comparing