



City Profile
Marion, Iowa
USA · Comprehensive city data and intelligence
Marion, Iowa is one of the state's fastest-growing communities, located just northeast of Cedar Rapids within the vibrant Creative Corridor. Founded in 1839 and originally named after the Revolutionary War hero Francis Marion, the city has evolved from a historic railroad hub into a thriving modern suburb known for its excellent school district and family-friendly atmosphere. Today, Marion successfully balances its rich historical heritage—highlighted by a charming uptown district featuring local boutiques, eateries, and brick-lined streets—with aggressive modern commercial and residential expansion. People are drawn to Marion for its strong sense of community, highly rated parks, and the unique combination of small-town charm and close proximity to major metropolitan job markets.
Iowa, located in the Midwest, is characterized by its expansive farmlands and a generally relaxed, community-focused lifestyle. The state's economy is diverse, with major industries including advanced manufacturing, biosciences, finance and insurance, and its foundational agricultural sector, which leads in corn, soybean, ethanol, and pork production. Living in Iowa is notably affordable, with the cost of living, particularly housing, being significantly lower than the national average. The climate is humid continental, featuring hot, humid summers and cold winters, with seasonal precipitation and susceptibility to various natural disasters like snowstorms, floods, and tornadoes.
How this 73/100 was calculated five components, with every reading behind them
| Component | Readings used | Points | Weight | Contributes |
|---|---|---|---|---|
| Safety | Safety score: 82 / 100 | 82.0 | 30% | 24.6 |
| Affordability | Cost of living index (100 = national baseline): 93.0 | 52.5 | 25% | 13.1 |
| Economy & jobs | Median household income: $84,500 Income needed to live here: $52,000 Unemployment rate: 3.2% | 92.5 | 20% | 18.5 |
| Growth | Population growth rate: 1.5% Job growth rate: 2.2% | 63.3 | 15% | 9.5 |
| Business climate assessment | Business climate assessment: 75 / 100 | 75.0 | 10% | 7.5 |
| Overall score | 73.2 | |||
Provenance.
These figures were produced by the research pass recorded as
Tier 1 (fast) (q=54, partial — below threshold), last refreshed
16 October 2026.
They are researched estimates drawn from public sources, not a licensed data feed.
Each component is scored against fixed published endpoints, so this number is comparable with any other city and does not move as the dataset grows. Scoring framework 2026.10 — full methodology, weights and accepted ranges.

Featured Events
Happening in Marion
Featured and sponsored events in Marion.
Local Directory
Businesses in Marion
Featured local businesses in Marion.

Performance
Quality Scores
Expenses
Cost of Living
The cost of living in Marion remains consistently below the national average, making it an attractive destination for young families, professionals, and retirees alike. Housing costs, including both median home prices and average rental rates, are particularly favorable compared to the broader United States baseline, allowing residents to secure more spacious properties for their investment. Everyday expenses such as groceries, utilities, and transportation are also reasonable, cushioned by Iowa's generally moderate utility rates and efficient local infrastructure.
While property taxes in Iowa can be relatively high, the overall financial burden is offset by the modest cost of goods and services throughout the Cedar Rapids metropolitan area. Local municipal investments in infrastructure and community amenities continue to enhance property value without imposing exorbitant tax spikes on homeowners. Consequently, households find that their disposable income stretches further here than in coastal urban centers or larger tier-one Midwestern cities.
Income
Salary Insights
Marion boasts a resilient and diversified local economy, deeply integrated with the broader Cedar Rapids-Iowa City economic region. Key employment sectors include advanced manufacturing, healthcare, education, financial services, and technology, with several major corporate employers and industrial parks anchoring the city's commercial base. The historic Uptown Marion district also supports a thriving ecosystem of small businesses, retail shops, and local dining establishments that contribute heavily to local job creation.
In addition to traditional on-site employment, Marion features a robust remote work infrastructure, supported by reliable high-speed broadband initiatives throughout the city's newer residential developments. The area's low unemployment rate reflects a steady demand for skilled labor, particularly in technical trades, healthcare administration, and specialized manufacturing. Continuous economic development efforts by the city government ensure that new commercial ventures frequently break ground, fostering sustained job growth.
The average salary in Marion is $68,000 per year. You would need approximately $52,000 to live comfortably.
Employment
Top Industries
Weather
Climate
Mobility
Transport
Transportation in Marion is predominantly car-dependent, with well-maintained roadways and efficient arterial corridors like Highway 151 and 13 facilitating seamless commutes throughout the metropolitan area. The average commute time is shorter than the national average, allowing residents to spend less time in traffic and more time at home. Public transit services are available via the Linn Countylift and regional connections, though fixed-route bus service is primarily centered in neighboring Cedar Rapids.
Pedestrian and bicycle infrastructure has seen substantial investment, particularly around the uptown district and newer trail connections, earning moderate walkability and bikeability scores for central neighborhoods. Parking is generally ample and free throughout the city's commercial zones, reducing the daily friction of running errands. Regional air travel is easily accessible via the Eastern Iowa Airport, located a short drive to the southwest.

At a Glance
Pros & Cons
Advantages
Drawbacks
Head to Head
Compare Marion
Community Q&A
Questions about Marion
What people ask about living in and moving to Marion, Iowa.
FAQ
Frequently Asked Questions
Senior Care in Marion
15 assisted living, nursing & memory care facilities in Marion.
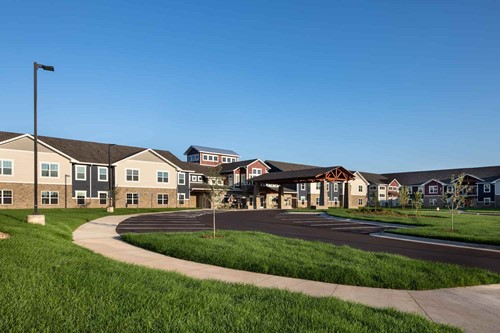 Senior Care
Terrace Glen Village - Assisted & Independent Living
Marion, IA
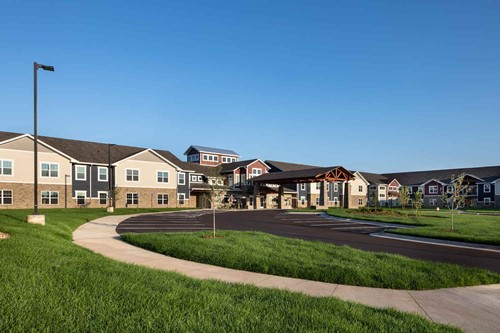 Assisted Living
Terrace Glen Village
Marion, IA
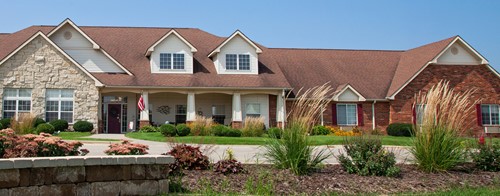 Assisted Living
Bickford of Marion
Marion, IA
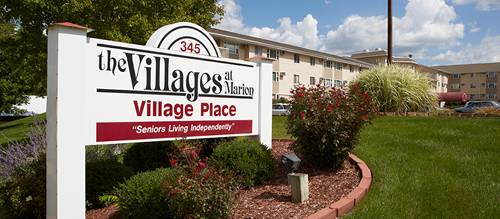 Senior Care
The Villages of Marion - Village Place Independent Living
Marion, IA
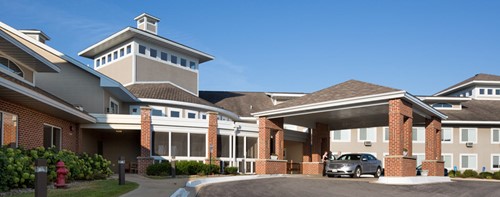 Assisted Living
The Villages of Marion - Village Ridge
Marion, IA
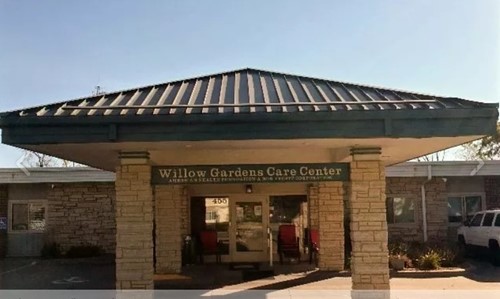 Assisted Living
Willow Gardens Care Center
Marion, IA
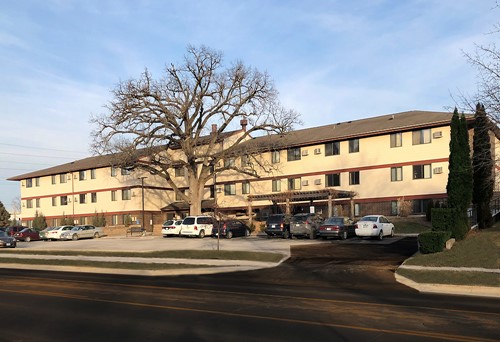 Senior Care
Oak Village Senior Residences
Marion, IA
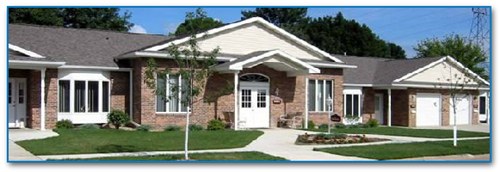 Senior Care
Linn Manor Apartments
Marion, IA
 Assisted Living
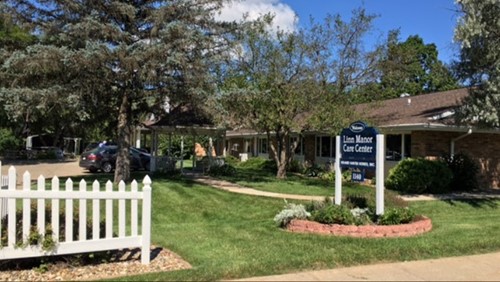
Linn Manor Care Center
Marion, IA
 Senior Care
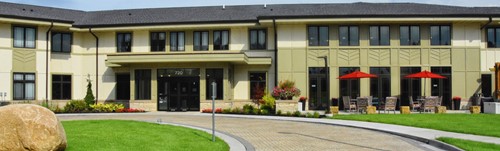
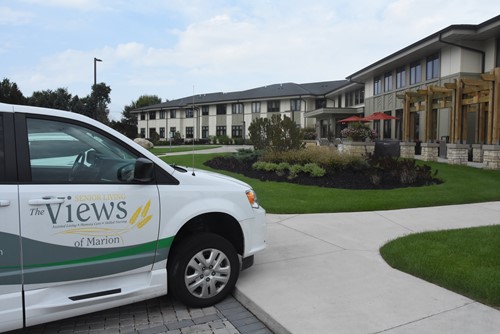
The Views of Marion - Independent, Assisted Living & Memory...
Marion, IA
 Assisted Living
Oakview Nursing & Rehablitation - Marion
Marion, IA
Winslow House Care Center
Marion, IA
Free Quotes
Get quotes from local pros in Marion
Tell us what you need and we’ll pass it to companies that serve your area. It’s free, and there’s no obligation.

Compare Marion with any city
See how it stacks up on cost, income, and quality of life.
Start Comparing