



City Profile
Cambridge, Massachusetts
USA · Comprehensive city data and intelligence
Cambridge, Massachusetts, is a globally renowned city located directly across the Charles River from Boston, steeped in rich American history dating back to its founding in 1630 as NewTowne. Best known as the home of two of the world's premier academic institutions—Harvard University and the Massachusetts Institute of Technology (MIT)—the city balances historic colonial charm with cutting-edge modernity. People are drawn to Cambridge for its intellectual vibrancy, progressive politics, exceptionally walkable neighborhoods, and dynamic urban culture.
Massachusetts is a New England state known for its rich history, world-class educational institutions, and diverse communities. Its economy is robust, driven by major industries such as technology, healthcare, biotechnology, finance, and education. Living in Massachusetts generally comes with a high cost of living, particularly for housing, which is significantly above the national average. The state experiences a humid continental climate with distinct four seasons, including cold, snowy winters and warm, rainy summers. The lifestyle is often characterized by a fast-paced, well-educated populace that values hard work, civic responsibility, and a vibrant cultural scene.
How this 57/100 was calculated five components, with every reading behind them
| Component | Readings used | Points | Weight | Contributes |
|---|---|---|---|---|
| Safety | Safety score: 78 / 100 | 78.0 | 30% | 23.4 |
| Affordability | Cost of living index (100 = national baseline): 165.0 | 0.0 | 25% | 0.0 |
| Economy & jobs | Median household income: $118,500 Income needed to live here: $85,000 Unemployment rate: 3.2% | 79.6 | 20% | 15.9 |
| Growth | Population growth rate: 0.8% Job growth rate: 2.4% | 56.5 | 15% | 8.5 |
| Business climate assessment | Business climate assessment: 92 / 100 | 92.0 | 10% | 9.2 |
| Overall score | 57.0 | |||
Provenance.
These figures were produced by the research pass recorded as
Tier 2 (reasoned) (q=54, partial — below threshold), last refreshed
16 October 2026.
They are researched estimates drawn from public sources, not a licensed data feed.
Each component is scored against fixed published endpoints, so this number is comparable with any other city and does not move as the dataset grows. Scoring framework 2026.10 — full methodology, weights and accepted ranges.

Featured Events
Happening in Cambridge
Featured and sponsored events in Cambridge.
Local Directory
Businesses in Cambridge
Featured local businesses in Cambridge.

Performance
Quality Scores
Expenses
Cost of Living
The cost of living in Cambridge is significantly higher than the national average, driven primarily by extreme housing demand, proximity to Boston, and a highly affluent, educated population. Everyday expenses such as groceries, dining out, and services also trend well above the US baseline, reflecting the local high-income economy. While wages in sectors like biotech and tech are robust, newcomers often experience sticker shock when navigating the local real estate and rental markets.
Income
Salary Insights
Cambridge boasts one of the most vibrant innovation economies in the United States, anchored by Kendall Square, often dubbed 'the most innovative square mile on the planet.' Major employment sectors include biotechnology, life sciences, higher education, software development, and professional scientific services. Major global employers like Novartis, Pfizer, Google, and Biogen operate major hubs here alongside thousands of startups. The local job market is exceptionally strong, with robust remote and hybrid work opportunities across professional fields.
The average salary in Cambridge is $92,000 per year. You would need approximately $85,000 to live comfortably.
Employment
Top Industries
Weather
Climate
Mobility
Transport
Cambridge is a paradise for pedestrians, cyclists, and public transit users, featuring some of the highest walkability and transit scores in the country. The MBTA Red Line provides rapid subway access directly into downtown Boston, while numerous reliable bus lines crisscross the city's distinct squares. Car ownership can be burdensome and expensive due to tight street parking, heavy traffic congestion during peak hours, and prioritizing non-motorized transit infrastructure.

At a Glance
Pros & Cons
Advantages
Drawbacks
Head to Head
Compare Cambridge
Community Q&A
Questions about Cambridge
What people ask about living in and moving to Cambridge, Massachusetts.
FAQ
Frequently Asked Questions
Businesses for Sale in Cambridge
Explore active acquisition & franchise opportunities .
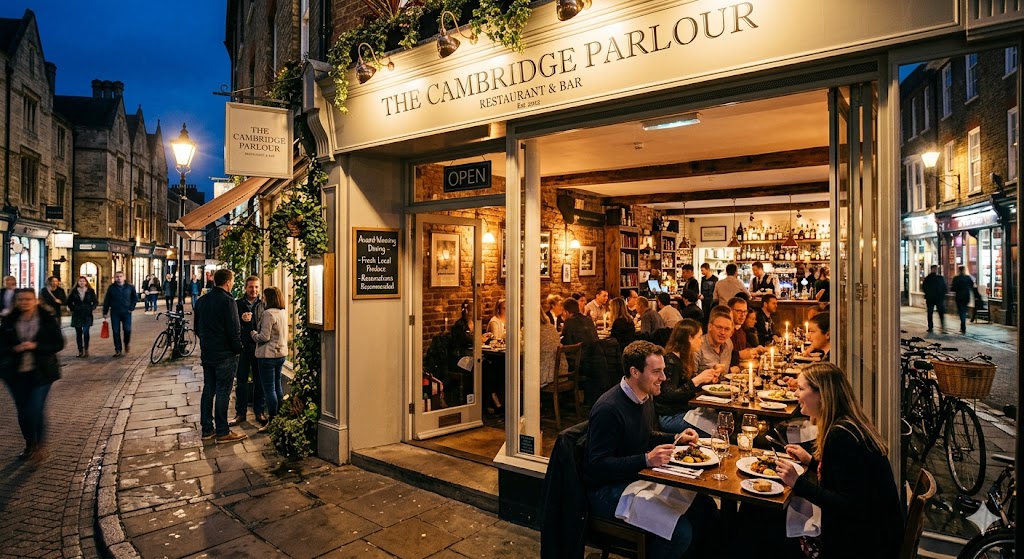

Senior Care in Cambridge
9 assisted living, nursing & memory care facilities in Cambridge.
 Senior Care
Cambridge Housing Authority
Cambridge, MA
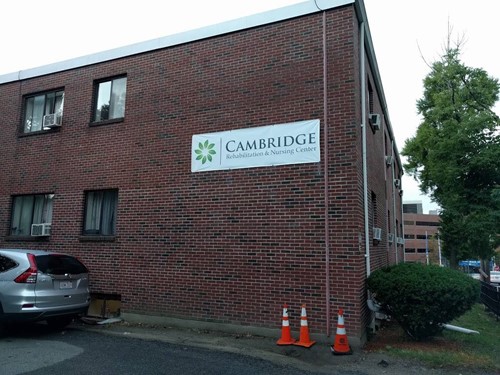 Assisted Living
Cambridge Rehabilitation & Nursing Center
Cambridge, MA
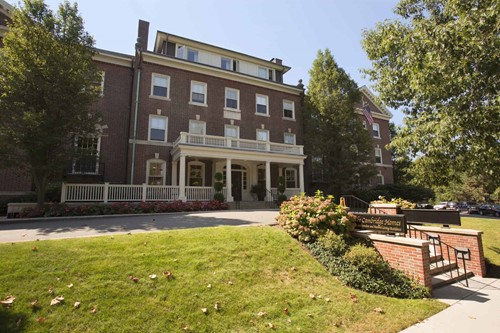 Senior Care
The Cambridge Homes
Cambridge, MA
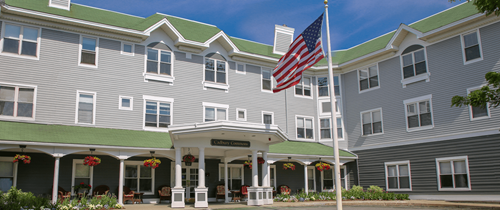 Senior Care
Cadbury Commons
Cambridge, MA
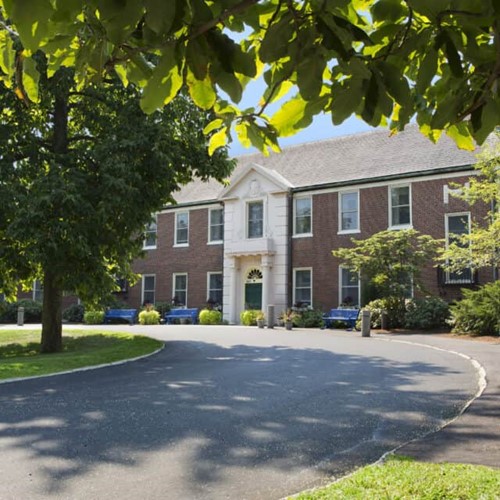 Assisted Living
Neville Place
Cambridge, MA
Assisted Living
Cambridge Rehabilitation & Nursing Center
Cambridge, MA
Senior Care
The Cambridge Homes
Cambridge, MA
Senior Care
Cadbury Commons
Cambridge, MA
Assisted Living
Neville Place
Cambridge, MA
City Guide
Explore Cambridge
Free Quotes
Get quotes from local pros in Cambridge
Tell us what you need and we’ll pass it to companies that serve your area. It’s free, and there’s no obligation.

Compare Cambridge with any city
See how it stacks up on cost, income, and quality of life.
Start Comparing