



City Profile
Lynn, Massachusetts
USA · Comprehensive city data and intelligence
Lynn, Massachusetts is a historic industrial and coastal city located in Essex County, roughly four miles northeast of Boston. Settled in 1629 and famously known as the 'City of Firsts' for its pioneering role in early American manufacturing, it evolved from colonial shoe and leather production into a powerhouse of heavy industry anchored by GE Aerospace. Today, Lynn is celebrated for its dynamic cultural diversity, thriving arts scene centered around a revitalized downtown district, and miles of scenic coastline along the Atlantic Ocean. People move to Lynn for its relatively accessible housing stock compared to downtown Boston, combined with robust commuter rail connections and an energetic urban character.
Massachusetts is a New England state known for its rich history, world-class educational institutions, and diverse communities. Its economy is robust, driven by major industries such as technology, healthcare, biotechnology, finance, and education. Living in Massachusetts generally comes with a high cost of living, particularly for housing, which is significantly above the national average. The state experiences a humid continental climate with distinct four seasons, including cold, snowy winters and warm, rainy summers. The lifestyle is often characterized by a fast-paced, well-educated populace that values hard work, civic responsibility, and a vibrant cultural scene.
How this 53/100 was calculated five components, with every reading behind them
| Component | Readings used | Points | Weight | Contributes |
|---|---|---|---|---|
| Safety | Safety score: 65 / 100 | 65.0 | 30% | 19.5 |
| Affordability | Cost of living index (100 = national baseline): 108.0 | 33.8 | 25% | 8.4 |
| Economy & jobs | Median household income: $75,043 Income needed to live here: $65,000 Unemployment rate: 5.2% | 52.2 | 20% | 10.4 |
| Growth | Population growth rate: 0.64% Job growth rate: 1.8% | 48.5 | 15% | 7.3 |
| Business climate assessment | Business climate assessment: 70 / 100 | 70.0 | 10% | 7.0 |
| Overall score | 52.6 | |||
Provenance.
These figures were produced by the research pass recorded as
Gemini (ungrounded) (q=55, partial — below threshold), last refreshed
12 October 2026.
They are researched estimates drawn from public sources, not a licensed data feed.
Each component is scored against fixed published endpoints, so this number is comparable with any other city and does not move as the dataset grows. Scoring framework 2026.10 — full methodology, weights and accepted ranges.

Featured Events
Happening in Lynn
Featured and sponsored events in Lynn.
Local Directory
Businesses in Lynn
Featured local businesses in Lynn.

Performance
Quality Scores
Expenses
Cost of Living
The cost of living in Lynn sits moderately above the national average, heavily influenced by its proximity to the greater Boston metropolitan real estate market. Housing represents the largest expense for residents, with home prices and monthly rents reflecting strong regional demand despite being more affordable than neighboring coastal communities like Swampscott or Marblehead. Everyday expenses such as groceries, utilities, and transportation track relatively close to state norms, though savings can be realized by shopping at local neighborhood markets and utilizing public transit.
While municipal taxes and utility rates add to standard household expenditures, Lynn's cost profile remains attractive for working professionals and families seeking urban-suburban living within striking distance of Boston's economic core. Local initiatives and continued downtown commercial investments have helped buffer residents against some of the sharper inflationary pressures felt elsewhere in Suffolk and Middlesex counties. Overall, careful budgeting allows households to navigate the local economy comfortably while enjoying coastal access and urban amenities.
Income
Salary Insights
Lynn's economic landscape is anchored by a mix of advanced manufacturing, healthcare, education, and professional services. GE Aerospace stands out as a foundational historic employer, providing thousands of high-skilled engineering and manufacturing jobs within the city limits. Additionally, the broader healthcare and social assistance sector—bolstered by regional medical networks and local health centers—serves as a massive employment engine alongside educational services provided by the public school system and local institutions.
The city's designation as a Massachusetts Gateway City has spurred targeted economic development, encouraging new small businesses, creative arts enterprises, and technology-adjacent startups to set down roots in its urban core. A growing number of residents also engage in remote or hybrid work setups, taking advantage of local co-working spaces and swift commuter rail lines into Boston. This diverse employment base provides solid resilience against economic downturns and steady career opportunities across multiple sectors.
The average salary in Lynn is $75,043 per year. You would need approximately $65,000 to live comfortably.
Employment
Top Industries
Weather
Climate
Mobility
Transport
Transportation in Lynn is a major draw for commuters, anchored by the MBTA Commuter Rail's Newburyport/Rockport Line, which connects Central Square to Boston's North Station in under twenty minutes. A comprehensive network of MBTA bus routes also crisscrosses the city, providing reliable connections to surrounding hubs like Malden, Revere, and Peabody. For drivers, major arterial routes such as Route 1A and Route 107 offer direct paths toward Boston and the wider North Shore region.
With a commendable walk score of 70 for central neighborhoods, daily errands can often be accomplished on foot without relying entirely on a car. While bicycle infrastructure is progressively expanding, many residents find that a combination of walking, commuter rail, and occasional driving creates a highly functional transit routine. Traffic congestion during peak rush hours remains a typical urban hurdle, but transit alternatives help mitigate commute stress.

At a Glance
Pros & Cons
Advantages
Drawbacks
Community Q&A
Questions about Lynn
What people ask about living in and moving to Lynn, Massachusetts.
FAQ
Frequently Asked Questions
Senior Care in Lynn
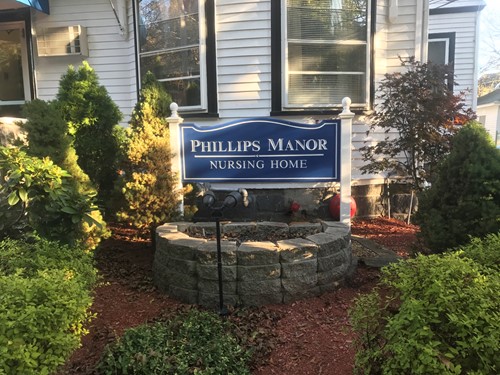
3 assisted living, nursing & memory care facilities in Lynn.

City Guide
Explore Lynn
Free Quotes
Get quotes from local pros in Lynn
Tell us what you need and we’ll pass it to companies that serve your area. It’s free, and there’s no obligation.

Compare Lynn with any city
See how it stacks up on cost, income, and quality of life.
Start Comparing