



City Profile
New Castle, Delaware
USA · Comprehensive city data and intelligence
New Castle, Delaware, is a historic waterfront city founded in 1651 by the Dutch, predating Philadelphia. Located along the Delaware River, it boasts one of the best-preserved colonial and federal-era village centers in the United States, anchored by the iconic New Castle Court House. Residents and visitors are drawn to its cobblestone streets, brick pathways, and a strong sense of colonial heritage blended with modern convenience. The community offers a peaceful, small-town atmosphere while sitting just minutes away from major urban centers like Wilmington and driving distance to Philadelphia.
Delaware, known as "The First State," offers a diverse character ranging from bustling urban centers like Wilmington to serene beaches and farmlands. Its economy is robust, heavily influenced by the finance and insurance sector, which contributes significantly to the state's GDP, alongside major industries such as chemical manufacturing, healthcare, and retail trade. Living in Delaware generally presents a moderate cost of living, often near the national average, with the advantage of no sales tax and relatively low property taxes. The state experiences a humid subtropical climate, characterized by hot, humid summers and mild winters, with precipitation distributed throughout the year. Residents can enjoy a lifestyle that blends small-town charm with access to major East Coast cities and abundant outdoor recreational opportunities.
How this 61/100 was calculated five components, with every reading behind them
| Component | Readings used | Points | Weight | Contributes |
|---|---|---|---|---|
| Safety | Safety score: 74 / 100 | 74.0 | 30% | 22.2 |
| Affordability | Cost of living index (100 = national baseline): 98.0 | 46.3 | 25% | 11.6 |
| Economy & jobs | Median household income: $65,400 Income needed to live here: $54,000 Unemployment rate: 4.2% | 61.9 | 20% | 12.4 |
| Growth | Population growth rate: 0.8% Job growth rate: 1.9% | 51.5 | 15% | 7.7 |
| Business climate assessment | Business climate assessment: 70 / 100 | 70.0 | 10% | 7.0 |
| Overall score | 60.9 | |||
Provenance.
These figures were produced by the research pass recorded as
Tier 1 (fast) (q=52, partial — below threshold), last refreshed
15 October 2026.
They are researched estimates drawn from public sources, not a licensed data feed.
Each component is scored against fixed published endpoints, so this number is comparable with any other city and does not move as the dataset grows. Scoring framework 2026.10 — full methodology, weights and accepted ranges.

Featured Events
Happening in New Castle
Featured and sponsored events in New Castle.
Local Directory
Businesses in New Castle
Featured local businesses in New Castle.

Performance
Quality Scores
Expenses
Cost of Living
The cost of living in New Castle aligns closely with the national average, though certain expenses like housing and utilities can fluctuate slightly relative to neighboring regions in Delaware and Pennsylvania. Property taxes in Delaware are generally considered moderate, which helps offset some homeownership costs compared to surrounding states. Everyday goods, groceries, and transportation remain reasonably priced, making the area attractive for families and professionals seeking suburban comfort without exorbitant metro pricing. Energy costs are typical for the Mid-Atlantic region, driven by seasonal heating and cooling demands.
Income
Salary Insights
New Castle benefits from a diverse local economy bolstered by its strategic location along major transportation corridors like Interstate 95 and the Delaware Memorial Bridge. Major employment sectors include healthcare, education, logistics, manufacturing, and public administration. Proximity to Wilmington and the broader Delaware corporate and financial footprint provides ample professional opportunities. Additionally, the region supports a growing remote work population seeking a scenic environment with reliable digital infrastructure.
The average salary in New Castle is $68,000 per year. You would need approximately $54,000 to live comfortably.
Employment
Top Industries
Weather
Climate
Mobility
Transport
Transportation in New Castle is predominantly car-dependent, though the historic core is exceptionally walkable and pedestrian-friendly. Public transit is serviced by DART First State bus routes connecting residents to Wilmington and surrounding New Castle County destinations. Major highways, including U.S. Route 13 and Interstate 295, provide efficient regional commuting access. The Philadelphia International Airport is conveniently located just a short drive north across the state line.

At a Glance
Pros & Cons
Advantages
Drawbacks
Head to Head
Compare New Castle
Community Q&A
Questions about New Castle
What people ask about living in and moving to New Castle, Delaware.
FAQ
Frequently Asked Questions
Senior Care in New Castle
9 assisted living, nursing & memory care facilities in New Castle.
 Senior Care
New Castle Health & Rehabilitation Center
New Castle, DE
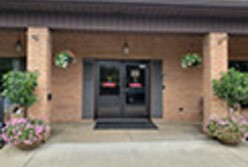 Assisted Living
New Castle Health And Rehabilitation Center
New Castle, DE
Assisted Living
New Castle Health And Rehabilitation Center
New Castle, DE
Christianacare Homehealth
New Castle, DE
Comfort Keepers - New Castle
New Castle, DE
Bayada Home Health Care, Inc
New Castle, DE
Christianacare Homehealth
New Castle, DE
Comfort Keepers - New Castle
New Castle, DE
Bayada Home Health Care, Inc
New Castle, DE
Free Quotes
Get quotes from local pros in New Castle
Tell us what you need and we’ll pass it to companies that serve your area. It’s free, and there’s no obligation.

Compare New Castle with any city
See how it stacks up on cost, income, and quality of life.
Start Comparing