



City Profile
Wilmington, Delaware
USA · Comprehensive city data and intelligence
Wilmington, Delaware, serves as the economic and cultural heart of New Castle County, nestled neatly at the confluence of the Christina River and Brandywine Creek. Originally established as Fort Christina by early Swedish settlers in 1638, the city evolved into a major manufacturing and corporate hub, earning recognition historically as both the chemical and corporate capital of the world. Today, it blends a rich industrial heritage with revitalized urban spaces, offering historic districts like Quaker Hill alongside sleek modern developments along its riverfront. People are drawn to Wilmington for its strategic East Coast positioning, unique corporate-friendly landscape, and access to major metropolitan amenities without the staggering price tags of nearby Philadelphia or New York.
Delaware, known as "The First State," offers a diverse character ranging from bustling urban centers like Wilmington to serene beaches and farmlands. Its economy is robust, heavily influenced by the finance and insurance sector, which contributes significantly to the state's GDP, alongside major industries such as chemical manufacturing, healthcare, and retail trade. Living in Delaware generally presents a moderate cost of living, often near the national average, with the advantage of no sales tax and relatively low property taxes. The state experiences a humid subtropical climate, characterized by hot, humid summers and mild winters, with precipitation distributed throughout the year. Residents can enjoy a lifestyle that blends small-town charm with access to major East Coast cities and abundant outdoor recreational opportunities.
How this 52/100 was calculated five components, with every reading behind them
| Component | Readings used | Points | Weight | Contributes |
|---|---|---|---|---|
| Safety | Safety score: 52 / 100 | 52.0 | 30% | 15.6 |
| Affordability | Cost of living index (100 = national baseline): 95.0 | 50.0 | 25% | 12.5 |
| Economy & jobs | Median household income: $58,671 Income needed to live here: $55,000 Unemployment rate: 4.9% | 48.5 | 20% | 9.7 |
| Growth | Population growth rate: 0.78% Job growth rate: 1.5% | 47.3 | 15% | 7.1 |
| Business climate assessment | Business climate assessment: 75 / 100 | 75.0 | 10% | 7.5 |
| Overall score | 52.4 | |||
Provenance.
These figures were produced by the research pass recorded as
Gemini (Tier 2 (reasoned), q=71), last refreshed
11 October 2026.
They are researched estimates drawn from public sources, not a licensed data feed.
Each component is scored against fixed published endpoints, so this number is comparable with any other city and does not move as the dataset grows. Scoring framework 2026.10 — full methodology, weights and accepted ranges.

Featured Events
Happening in Wilmington
Featured and sponsored events in Wilmington.
Local Directory
Businesses in Wilmington
Featured local businesses in Wilmington.

Performance
Quality Scores
Expenses
Cost of Living
The cost of living in Wilmington hovers slightly below the national average, making it an attractive destination for workers seeking affordability paired with urban accessibility. While housing costs and rental prices fluctuate based on proximity to the revitalized Downtown or the Riverfront, average rent trends remain generally reasonable compared to broader regional metropolitan centers. Everyday expenses such as groceries, utilities, and transportation remain manageable, though property taxes and specific lifestyle choices can influence individual budgeting. Overall, residents find that their purchasing power stretches further here than in major northern corridor cities, balancing moderate local salaries with realistic living expenditures.
Income
Salary Insights
Wilmington boasts a dynamic and resilient economy anchored heavily by financial services, legal sectors, and corporate law. Because a vast majority of Fortune 500 companies are legally incorporated in Delaware, the city acts as a magnet for corporate headquarters, banking giants like Bank of America, and specialized professional services. In addition to finance and law, healthcare and social assistance, biotechnology, and chemical sciences drive robust employment numbers. The local job market benefits from a well-educated regional labor force and strong remote and hybrid work flexibility, tapping into the broader Philadelphia-Camden-Wilmington metropolitan economic ecosystem.
The average salary in Wilmington is $76,681 per year. You would need approximately $55,000 to live comfortably.
Employment
Top Industries
Weather
Climate
Mobility
Transport
Getting around Wilmington is convenient thanks to its compact layout and major regional transit connections. The Joseph R. Biden Jr. Railroad Station anchors the city on the Northeast Corridor, offering seamless Amtrak and SEPTA commuter rail service that connects residents to Philadelphia in 20 minutes, Washington D.C. in under an hour and a half, and New York City with ease. While many residents rely on cars for daily commuting via Interstate 95, the city features navigable pockets, bike paths, and local DART bus routes that support alternative transit.

At a Glance
Pros & Cons
Advantages
Drawbacks
Head to Head
Compare Wilmington
Community Q&A
Questions about Wilmington
What people ask about living in and moving to Wilmington, Delaware.
FAQ
Frequently Asked Questions
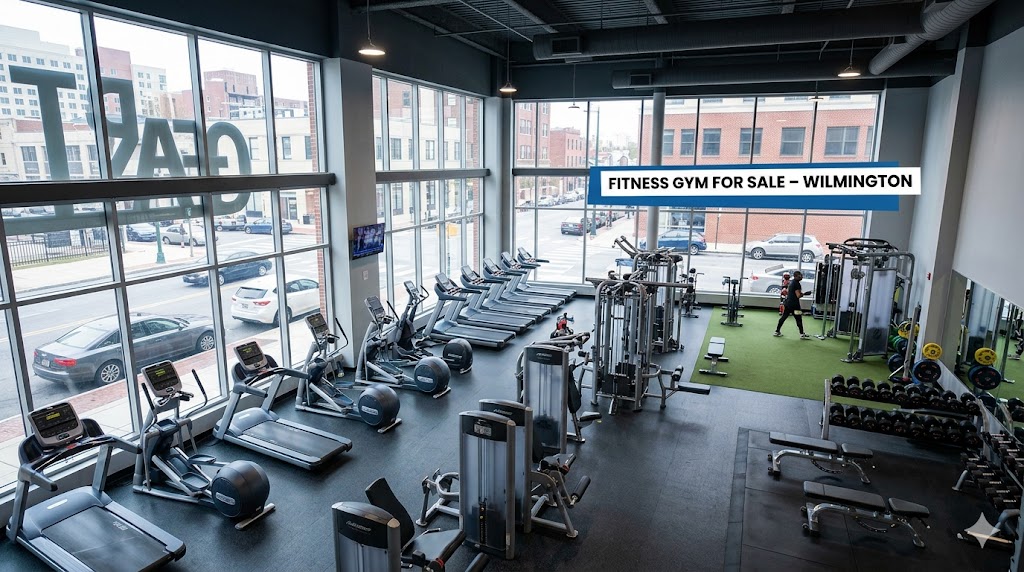
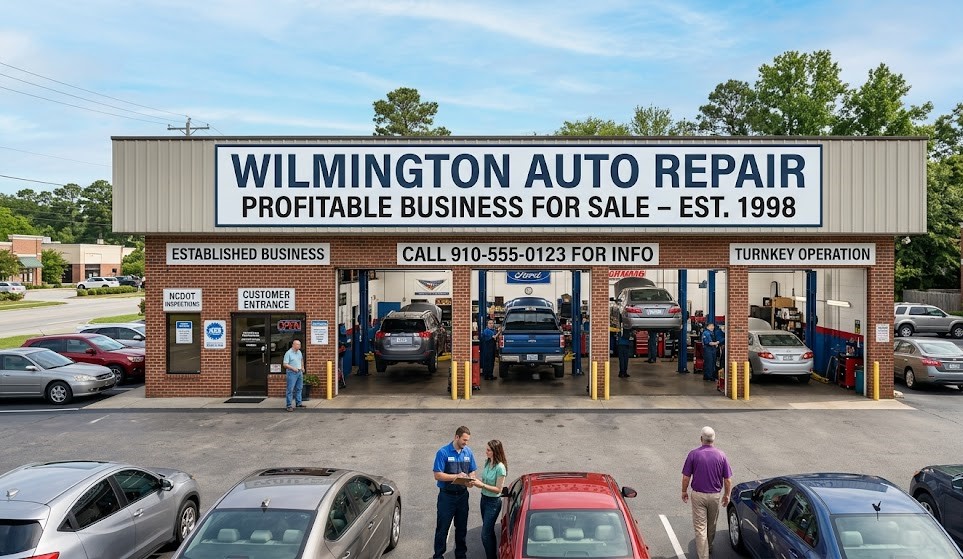
Businesses for Sale in Wilmington
Explore active acquisition & franchise opportunities .
Senior Care in Wilmington
77 assisted living, nursing & memory care facilities in Wilmington.
 Assisted Living
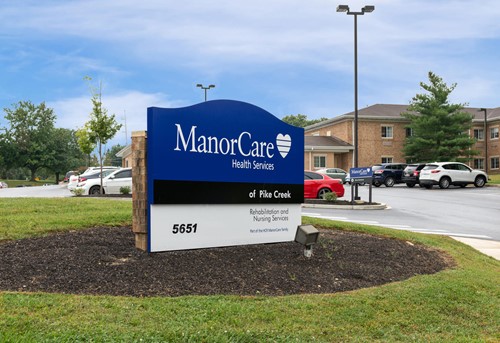
Promedica Skilled Nursing and Rehab - Pike Creek
Wilmington, DE
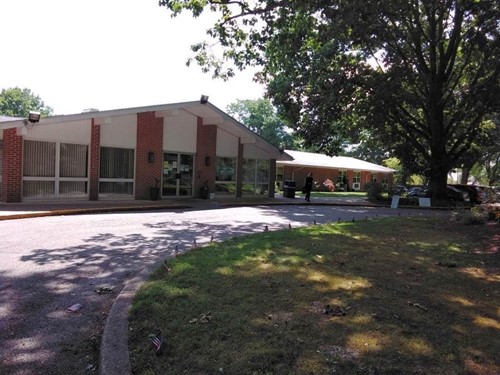 Assisted Living
Coral Springs Rehab & Healthcare
Wilmington, DE
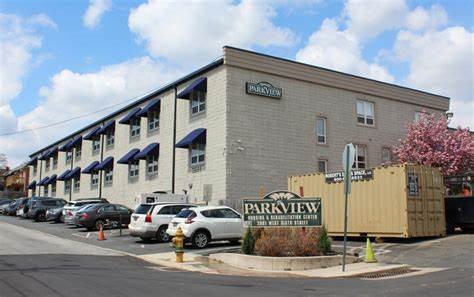 Assisted Living
Parkview Nursing
Wilmington, DE
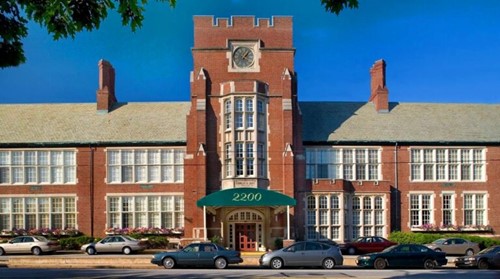 Assisted Living
Lorelton
Wilmington, DE
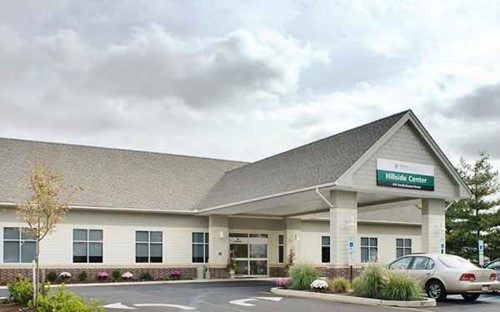 Assisted Living
Complete Care At Hillside
Wilmington, DE
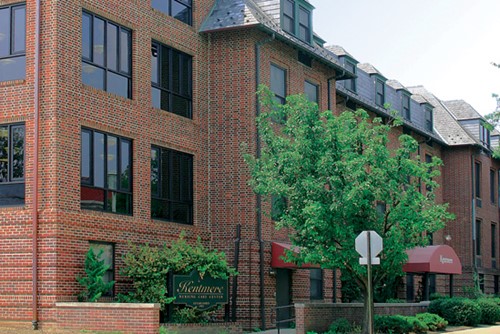 Assisted Living
Kentmere Rehabilitation And Healthcare Center
Wilmington, DE
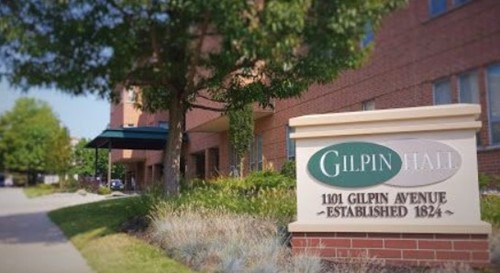 Assisted Living
Gilpin Hall
Wilmington, DE
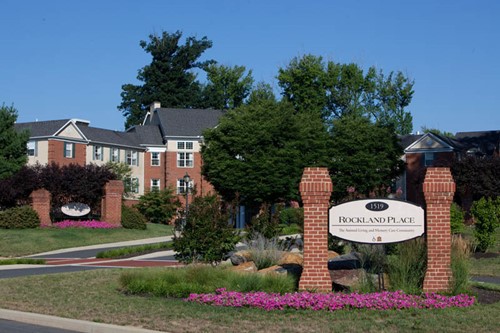 Assisted Living
Rockland Place
Wilmington, DE
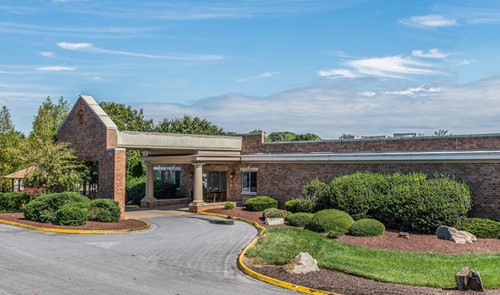 Assisted Living
Promedica Skilled Nursing and Rehab - Wilmington
Wilmington, DE
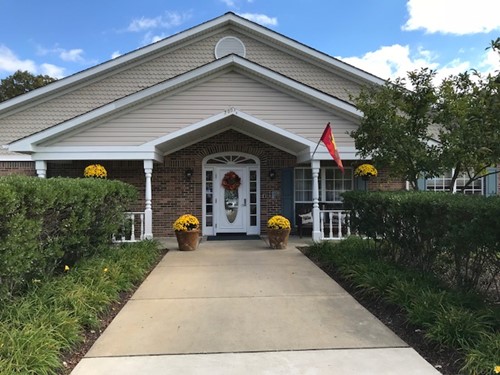 Assisted Living
Arden Courts of Wilmington - A ProMedica Memory Care Communi...
Wilmington, DE
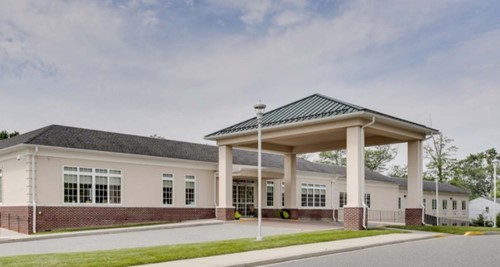 Assisted Living
Cadia Rehabilitation Silverside
Wilmington, DE
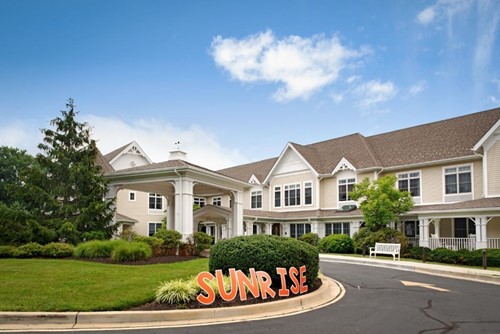 Assisted Living
Sunrise of Wilmington
Wilmington, DE
City Guide
Explore Wilmington
Free Quotes
Get quotes from local pros in Wilmington
Tell us what you need and we’ll pass it to companies that serve your area. It’s free, and there’s no obligation.

Compare Wilmington with any city
See how it stacks up on cost, income, and quality of life.
Start Comparing