



City Profile
Englewood, Colorado
USA · Comprehensive city data and intelligence
Colorado is characterized by its diverse geography, ranging from the Rocky Mountains to the Eastern Plains, offering a lifestyle that blends natural beauty with community charm and extensive outdoor recreation opportunities. The state's economy is robust and diversified, with major industries including aerospace, bioscience, technology, energy and natural resources, financial services, and a strong tourism sector. Living in Colorado is generally more expensive than the national average, with housing costs being a primary driver. The climate is diverse, featuring four distinct seasons with abundant sunshine, though it can experience rapid weather shifts, including hot summers, cold winters, and occasional extreme weather events like flash floods and strong winds.

Featured Events
Happening in Englewood
Featured and sponsored events in Englewood.
Local Directory
Businesses in Englewood
Featured local businesses in Englewood.


Head to Head
Compare Englewood
Community Q&A
Questions about Englewood
What people ask about living in and moving to Englewood, Colorado.
FAQ
Frequently Asked Questions
Senior Care in Englewood
19 assisted living, nursing & memory care facilities in Englewood.
 Assisted Living
Julia Temple Healthcare Center
Englewood, CO
 Senior Care
The Belleview
Englewood, CO
 Assisted Living
Englewood Post Acute And Rehabilitation
Englewood, CO
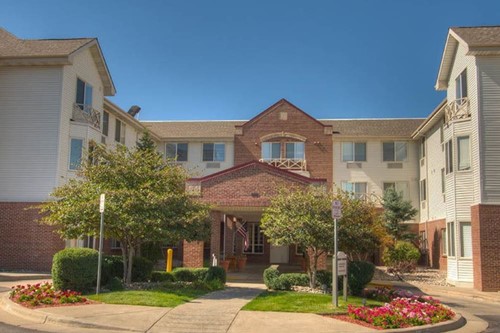 Assisted Living
Caley Ridge Assisted Living Community
Englewood, CO
Home Helpers Home Care - Englewood
Englewood, CO
Touching Hearts at Home - Englewood
Englewood, CO
Homewatch CareGivers - Englewood
Englewood, CO
Serenity House VI
Englewood, CO
Meridian Englewood
Englewood, CO
Chateau Des Mons Care and Assisted Living
Englewood, CO
Klarus Home Care
Englewood, CO
Home Health Care Professionals Inc
Englewood, CO
Free Quotes
Get quotes from local pros in Englewood
Tell us what you need and we’ll pass it to companies that serve your area. It’s free, and there’s no obligation.

Compare Englewood with any city
See how it stacks up on cost, income, and quality of life.
Start Comparing